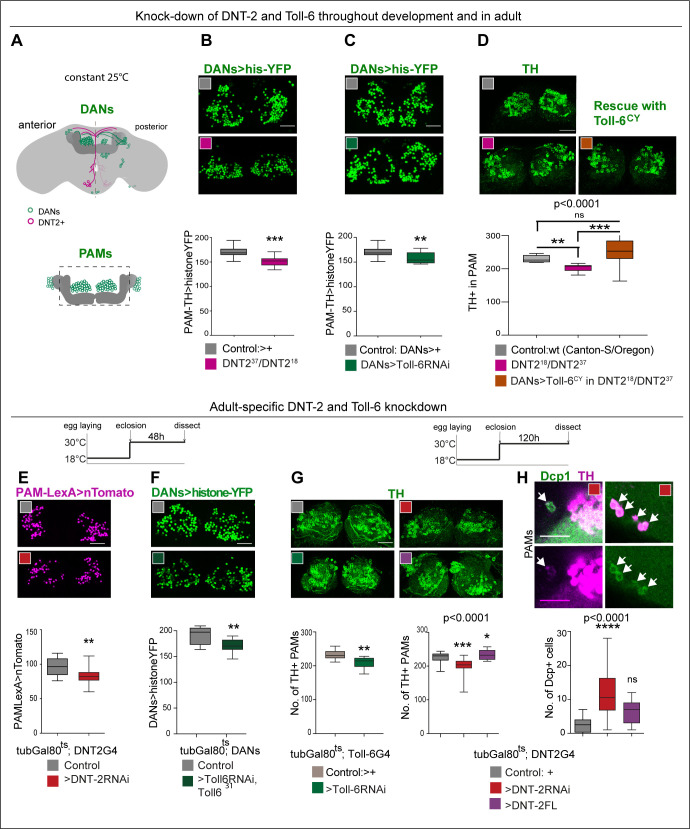
Figure 3. DNT-2 and Toll-6 maintain PAM neuron survival in the developing and adult brain.
(A) Illustration of PAM neuronal cell bodies and experimental temporal profile. DANs are shown in green, DNT-2A neurons in magenta, and MB in dark grey. The left hemisphere shows the anterior brain with PAL and PAM DAN neurons (green) and DNT-2 neurons (magenta); the right shows the posterior brain, with the calyx and other DAN neurons (PPM1, PPM2, PPM3, PPL1, PPL2, green). (B–D) Fruit flies were kept constantly at 25°C, from development to adult. Analyses done in adult brains. (B) DNT-237/DNT-218 mutants had fewer histone-YFP+-labelled PAM neurons (THGAL4, R58E02-GAL4>hisYFP). Unpaired Student’s t-test. (C) Toll-6 RNAi knock-down in all DANs (THGAL4, R58E02-GAL4>hisYFP, Toll-6 RNAi) reduced Histone-YFP+-labelled PAM cell number. Unpaired Student’s t-test. (D) DNT-237/DNT-218 mutants had fewer PAMs stained with anti-TH antibodies. Over-expressing Toll-6CY in DANs (THGAL4, R58E02 GAL4>hisYFP, Toll-6CY) rescued TH+ PAM neurons in DNT-237/DNT-218 mutants, demonstrating that DNT-2 functions via Toll-6 to maintain PAM cell survival. Welch ANOVA p<0.0001, post hoc Dunnett test. (E–H) Adult-specific restricted over-expression or knock-down at 30°C using the temperature-sensitive GAL4 repressor tubGAL80ts. (E) Adult-specific DNT-2 RNAi knock-down in DNT-2 neurons decreased Tomato+ PAM cell number (tubGAL80ts, R58E02-LexA, DNT-2 GAL4>LexAOP-Tomato, UAS DNT-2-RNAi). Unpaired Student’s t-test, p=0.005. (F) Adult-specific Toll-6 RNAi knock-down in Toll-631 heterozygous mutant flies in DANs, reduced Histone-YFP+ PAM cell number (tubGAL80ts; THGAL4, R58E02-GAL4>hisYFP, Toll-6 RNAi/Toll631). Unpaired Student’s t-test. (G) PAMs were visualised with anti-TH. Left: tubGAL80ts, Toll-6>Toll-6-RNAi knock-down decreased TH+ PAM cell number. Unpaired Student’s t-test. Right: tubGAL80ts, DNT-2>DNT-2-RNAi knock-down decreased TH+ PAM cell number, whereas DNT-2FL over-expression increased PAM cell number. Kruskal–Wallis ANOVA, p=0.0001, post hoc Dunn’s test. (H) Adult-specific tubGAL80ts, DNT-2>DNT-2RNAi knock-down increased the number of apoptotic cells in the brain labelled with anti-DCP-1. Dcp-1+ cells co-localise with anti-TH at least in PAM clusters. One-way ANOVA, p<0.0001, post hoc Bonferroni’s multiple comparisons test. DANs>histone-YFP: all dopaminergic neurons expressing histone-YFP, genotype: THGal4 R58E02Gal4>UAS-histoneYFP. PAMsLexA>tomato: restricted to PAM DANs: R58E02LexA >LexAop-nlstdTomato. Controls: GAL4 drivers crossed to wild-type Canton-S. Scale bars: (B–G) 30 µm; (H) 20 µm. Graphs show boxplots around the median. p-values over graphs in (D, G right, H) refer to group analyses; stars indicate multiple comparisons tests. *p<0.05, **p<0.01, ***p<0.001. For further genotypes, sample sizes, and statistical details, see Supplementary file 2.

