. 2024 Dec 20;13:RP102222. doi: 10.7554/eLife.102222

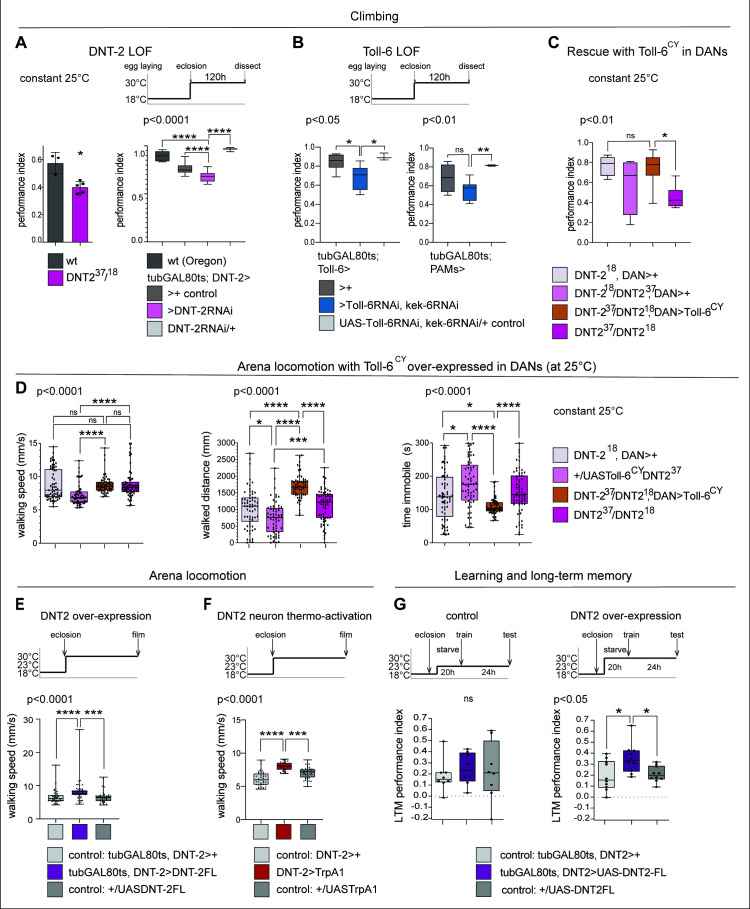
Figure 6. DNT-2-induced circuit plasticity modified dopamine-dependent behaviour.

(A) DNT-2 mutants (left, DNT-237/DNT-218) and flies with adult-specific RNAi knock-down of DNT-2 in DNT-2 neurons (right, tubGAL80ts; DNT-2>DNT-2RNAi), had impaired climbing. Left: Mann–Whitney U; right: one-way ANOV, post hoc Dunnett. (B) Adult-specific Toll-6 and kek-6 RNAi knock-down in Toll-6 (tubGAL80ts; Toll-6>Toll-6RNAi, kek-6RNAi, left) or PAM (tubGAL80ts; R58E02>Toll-6RNAi, kek-6RNAi, right) neurons impaired climbing. Left: Welch ANOVA, post hoc Dunnett. Right: Welch ANOVA, post hoc Dunnett. (C) The climbing impairment of DNT-2 mutants could be rescued with the over-expression of Toll-6CY in dopaminergic neurons (rescue genotype: UASToll-6CY/+; DNT-218THGAL4 R58E02GAL4/DNT-237). Welch ANOVA, post hoc Dunnett. (D) Adult-specific over-expression of Toll-6CY in DANs increased locomotion in DNT-237/DNT-218 mutants (test genotype: UASToll-6CY/+; DNT-218THGAL4 R58E02GAL4/DNT-237). Walking speed: Kruskal–Wallis ANOVA, post hoc Dunn’s. Distance walked: Kruskal–Wallis ANOVA, post hoc Dunn’s. Time spent immobile: Kruskal–Wallis ANOVA, post hoc Dunn’s. (E) Adult-specific DNT-2FL overexpression in DNT-2 neurons increased fruit fly locomotion speed in an open arena at 30°C (see also Figure 6—figure supplement 1A for further controls) (test genotype: tubGAL80ts, DNT-2>DNT-2FL) Kruskal–Wallis, post hoc Dunn’s test. (F) Thermogenetic activation of DNT-2 neurons at 30°C (DNT-2>TrpA1) increased fruit fly locomotion speed (see also Figure 6—figure supplement 1B for further controls). One-way ANOVA p<0.0001, post hoc Dunnett’s test. (G) Over-expression of DNT-2-FL in DNT-2 neurons increased long-term memory (test genotype: tubGAL80ts, DNT-2>DNT-2FL). Left: 23°C controls: one-way ANOVA p=0.8006. Right: 30°C: one-way ANOVA, post hoc Dunnett’s test. Graphs show boxplots around the median, under also dot plots. p-Values over graphs refer to group analyses; asterisks indicate multiple comparisons tests. *p<0.05, **p<0.01, ***p<0.001, ****p<0.0001; ns, not significantly different from control. For further genotypes, sample sizes, p-values, and other statistical details, see Supplementary file 2.

Figure 6—source code 1. FlyTracker MATLAB script to measure locomotion parameters.
Figure 6—source data 1. Quantitative results used to generate the graphs in Figure 6A, Figure 6—figure supplements 1 and 2.
Figure 6—source data 2. Quantitative data used to generate graphs in Figure 6B.
Figure 6—source data 3. Quantititative data used to generate graph in Figure 6C.
Figure 6—source data 4. Quantitative data used to generate graphs in Figure 6D.
Figure 6—source data 5. Quantitative data used to generate graph in Figure 6E.
Figure 6—source data 6. Quantitative data used to generate graph in Figure 6F.
Figure 6—source data 7. Quantitative data used to generate graphs in Figure 6G.

Figure 6.

Figure 6—figure supplement 1. Locomotion in open arena controls.
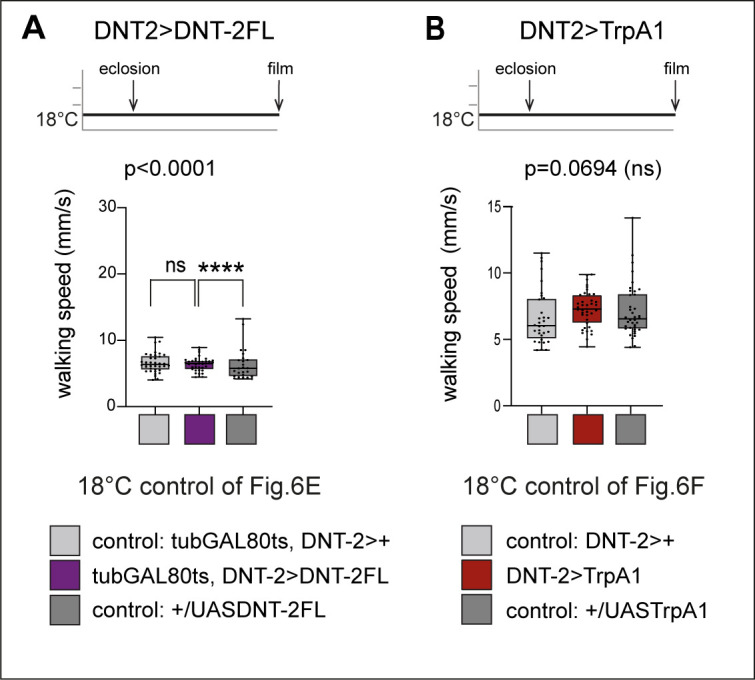
Figure 6—figure supplement 1.

(A) Controls for Figure 6E. In 18°C controls, GAL80 is on and GAL4 is off, thus there is no adult-specific DNT-2FL overexpression in DNT-2 neurons in these flies (genotype: tubGAL80ts, DNT-2>DNT-2FL). Consistently, there was no increase in locomotion speed in an open arena, in flies over-expressing DNT-2FL relative to controls, compare also to Figure 6E. Kruskal–Wallis ANOVA ns (lower median in UAS-DNT-2FL/+ control). (B) Controls for Figure 6F. The cation TrpA1 opens at high temperatures (e.g. 30°C) but remains closed at 18°C. Consistently, there was no effect in locomotion at 18°C in flies of genotype DNT-2>TrpA1 compared to controls, compare also to 30°C data in Figure 6F. Kruskal–Wallis ANOVA ns. For further genotypes, sample sizes, p-values, and other statistical details, see Supplementary file 2.
Figure 6—figure supplement 1—source data 1. Quantitative data used to generate graph in Figure 6—figure supplement 1A.
Figure 6—figure supplement 1—source data 2. Quantitative data used to generate graph in Figure 6—figure supplement 1B.
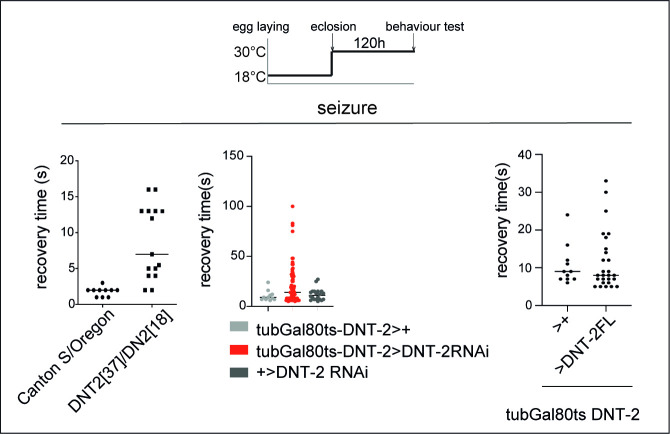
Figure 6—figure supplement 2. Altering DNT-2 levels induced seizures.

Figure 6—figure supplement 2.

Knock-down or over-expression of DNT-2 in the adult, using GAL80ts. Fruit flies were reared at 18°C from egg laying to adult eclosion, when they were transferred to 30°C and kept there for 5 days prior to testing. To test for seizures, we used the bang-sensitivity test. DNT237/DNT218 mutant flies (left) and adult DNT-2 knock-down flies (tubGal80ts DNT-2Gal4>DNT-2RNAi, centre) took longer to recover than controls. Over-expression of DNT-2FL in DNT-2 neurons (tubGal80ts DNT-2Gal4>DNT-2FL, right) increased variability in recovery time. For further genotypes and sample sizes, see Supplementary file 2.
Figure 6—figure supplement 2—source data 1. Quantitative data used to generate graph in Figure 6—figure supplement 2, left.
Figure 6—figure supplement 2—source data 2. Quantitative data used to generate graph in Figure 6—figure supplement 2, middle.
Figure 6—figure supplement 2—source data 3. Quantitative data used to generate graph in Figure 6—figure supplement 2, right.