Figure 10.

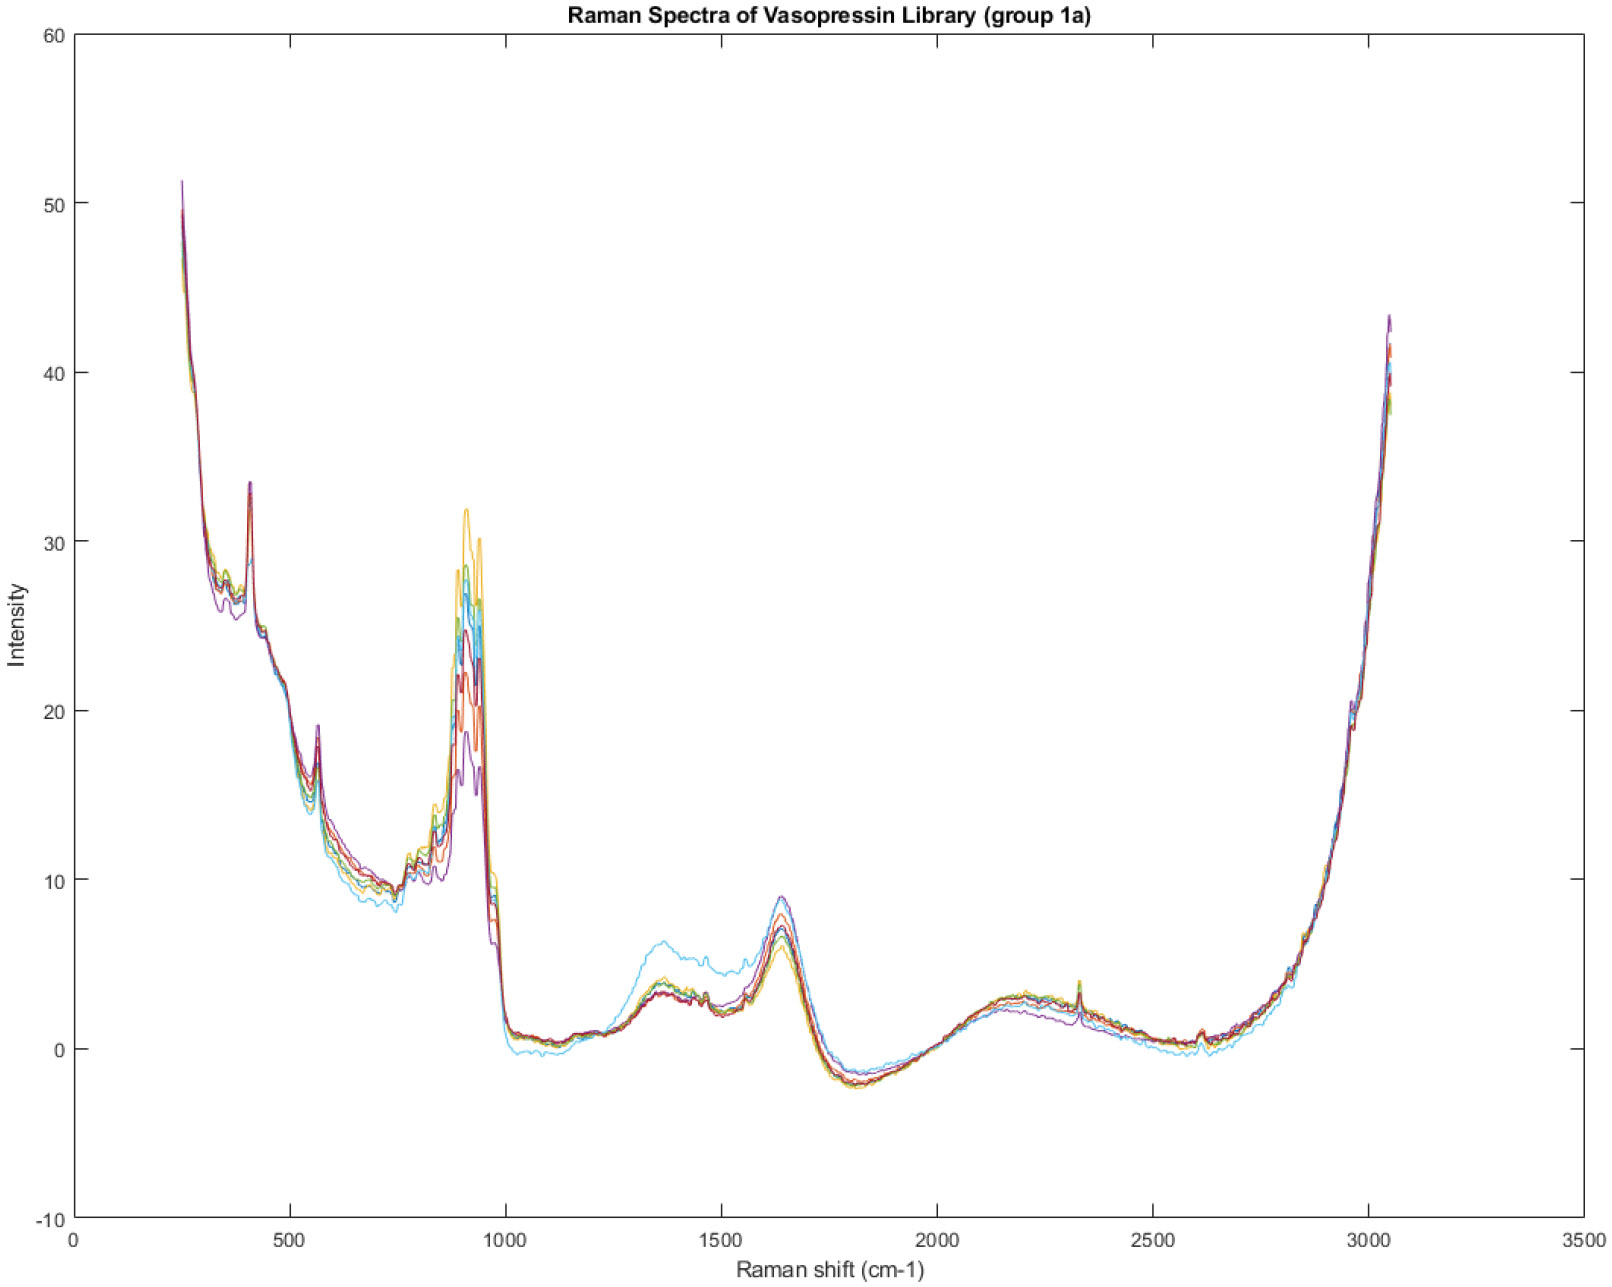
The Raman spectrum of group 1A identified in Figure 7. The most obvious difference between the spectra is in the size of a broad peak at about 1400 cm−1.

The Raman spectrum of group 1A identified in Figure 7. The most obvious difference between the spectra is in the size of a broad peak at about 1400 cm−1.