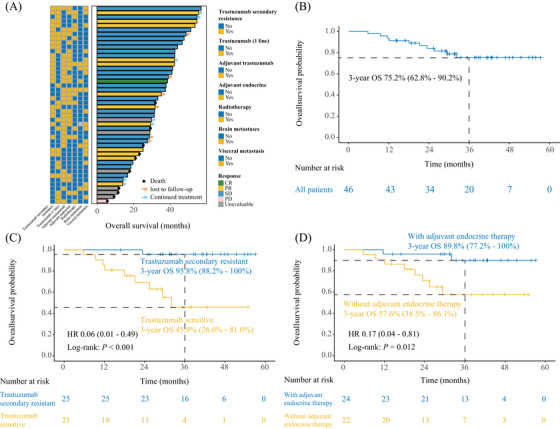
FIGURE 3.

Estimates of overall survival. (A) The overall survival distributions among enrolled patients. (B) Overall survival in total population. (C) Kaplan–Meier curves for overall survival by the subcategory of secondary trastuzumab resistance. (D) Kaplan–Meier curves for overall survival by the subcategory of adjuvant endocrine therapy. We calculated p‐values using the unadjusted log‐rank test and hazard ratios using univariate Cox regression analysis. CI, confidence interval; HR, hazard ratio; OS, overall survival.
