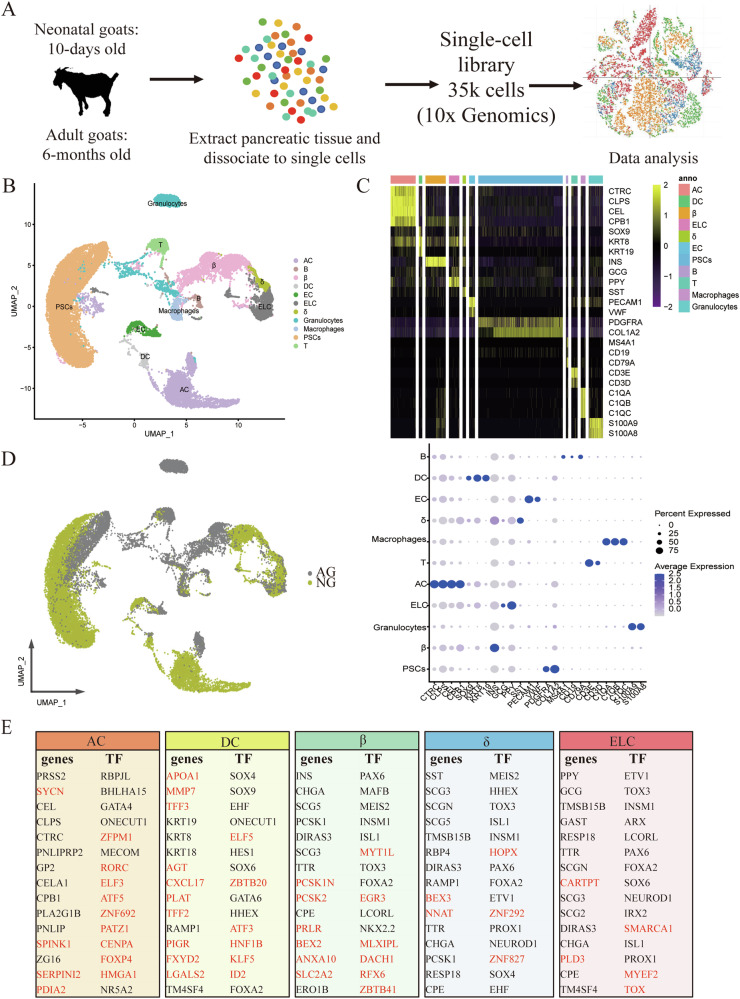
Fig. 2. A transcriptomic map of the goat pancreas.
A Single-cell RNA-seq was carried out on the goat pancreas using the 10x Genomics Chromium Controller to generate data that quantify transcript abundance across cells and genes. B Uniform manifold approximation and projection (UAMP) clustering of 35,449 cells isolated from pancreas of neonatal and adult goats. Cell type was annotated by the expression of known marker genes. Each dot represents a single cell. C Heatmap summarizing mean expression (normalized and log-transformed) of selected canonical markers in each cluster. The top bar indicates the assigned cluster identity (upper). Dot plotting showing gene signatures among different clusters, the shadings denote average expression levels and the sizes of dots denote fractional expression (bottom). D UAMP clustering of cells isolated from all samples. Cells are colored based on the groups. E Tables denoting the top fifteen differentially expressed genes and transcription factors (TFs) when comparing one cell type to all other cells in the dataset. Genes whose cell-type specificity was previously unknown in the pancreas are marked in red.

