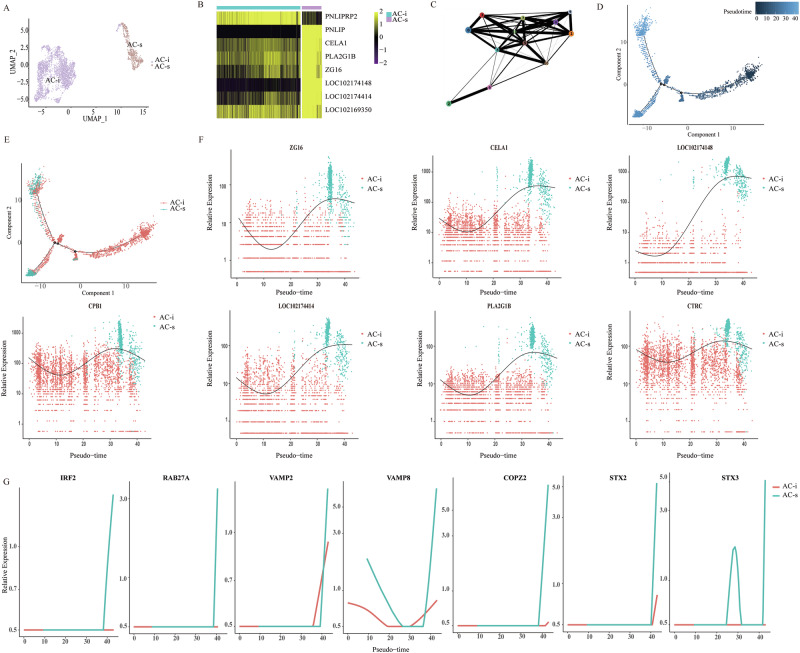
Fig. 3. Uncovering subtypes of AC cells.
A UAMP clustering of 3483 AC cells isolated from the pancreas of neonatal and adult goats. Colored according to the assigned subtypes. B Heatmap shows the expression of the selected 8 candidates (rows) between the two AC subtypes (columns) by multi-omics analysis. The colors in the heatmap correspond to standardized log2 expression values, where each heatmap cell contains the distribution of values across the cells in each cluster. The top bar indicates the assigned subtype identity. C PAGA abstracted graph showing the most probable subgraph representing the AC data manifold. Each node corresponds to a cluster, the size of nodes is proportional to the number of cells in each cluster and edges indicate potential routes of cell transitions between them. Trajectory analysis of acinar cells colored according to pseudotime (D) and AC subtypes (E). F Expression of pancreatic digestive enzyme related genes along pseudotime. G Expression of exocytosis related genes along pseudotime.

