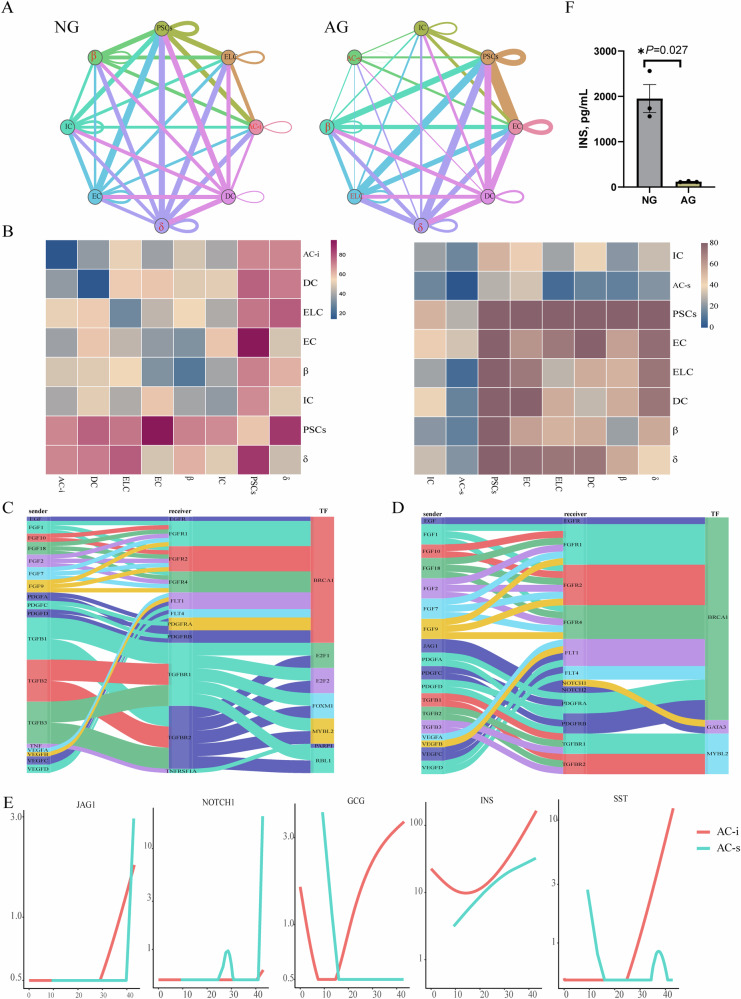
Fig. 4. Pancreatic is characterized by unique cell-to-cell signaling networks at different developmental stages.
A Networks depicting cell types as nodes and interactions as edges. Edge thickness is proportional to the number of interactions between the connecting types. Interested cell communications are marked in red. B Heat map depicting the number of all possible interactions between the clusters analyzed. C Sankey diagram depicting selected AC–ELC interactions enriched in the NG group. D Sankey diagram depicting selected AC–ELC interactions enriched in the AG group. E Expression of selected genes along pseudotime. F Serum insulin content in the AG and NG groups. N = 3 biologically independent samples/group. The standard error of the mean (SEM) is represented by error bars.

