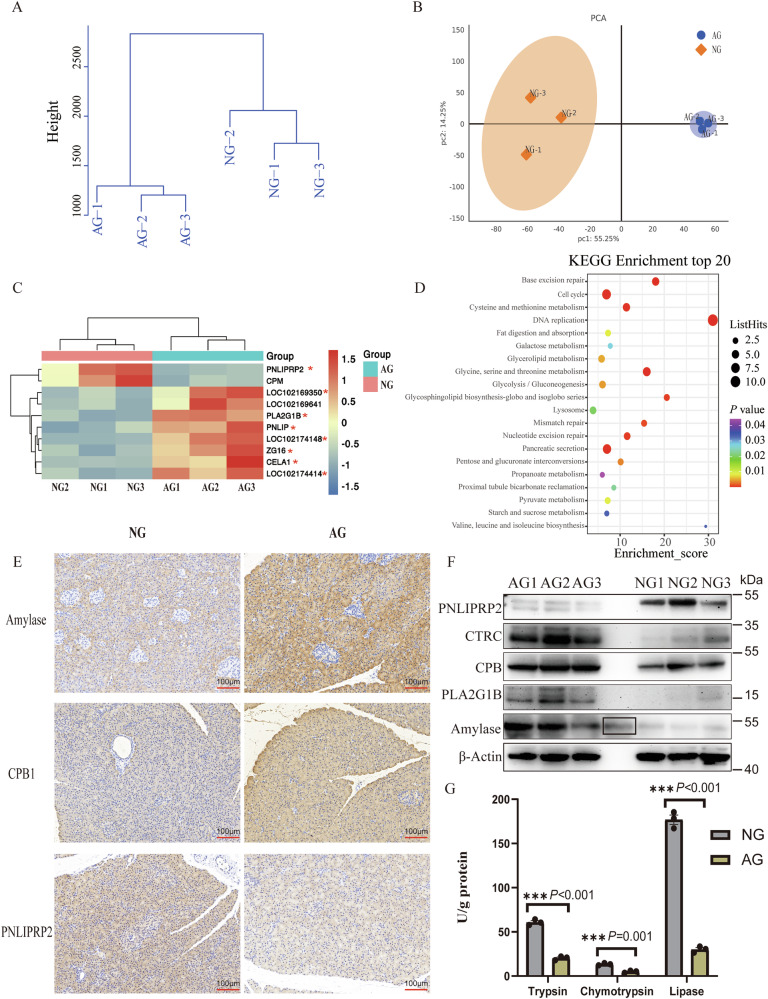
Fig. 6. Increased pancreatic exocrine function in adult goats.
A Hierarchical clustering dendrogram of sample Euclidean distance. B Principal component (PC) analysis of the pancreas transcriptomes for the AG (neonatal goats) and NG (adult goats (AG group) groups are shown by symbols of the different shapes. Circles represent the AG group, while diamonds represent the NG group. PC1 and PC2 represent the top two dimensions of detected proteins in the pancreatic tissue. C Heatmap of pancreatic digestive enzyme related differentially expressed proteins. Eight proteins were identified combined analysis of single-cell transcriptome and proteome and marked with red asterisks. D The top 20 KEGG enrichment pathways analysis of all DEPs in the AG group. E Immunohistochemical staining of Amylase, CPB1 and PNLIPRP2 in the pancreas from NG and AG group. Scale bar = 100 μm. F Western blot analysis of PNLIPRP2, CTRC, CPB1, PLA2G1B and Amylase in pancreatic tissue. β-Actin was used as the loading control. The black box represents the operation error during the spotting process and repeated spotting of AG3. G Pancreatic trypsin, chymotrypsin, and lipase activities in the AG and NG groups. N = 3 biologically independent samples/group. Standard error of the mean (SEM) represented error bars.

