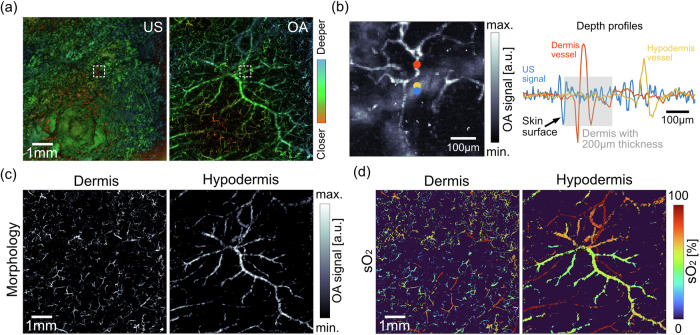
Fig. 2. Layer-specific visualization of microvascular morphology and sO2.
a The imaging system acquires volumetric pulse-echo US and OA images that are registered in depth. The same colors in both modalities indicate tissue structures located at the same distance to the transducer. The curved skin surface is delineated in the US image. Microvasculature in different skin layers is visualized in OA image. Both images were taken with 7 mm × 7 mm FOV. b Illustration on the segmentation of blood vessels in the dermis and hypodermis. A zoom-in OA image indicated by the white dashed box in (a) is shown, where a small-caliber dermis vessel (red dot) and a large-diameter hypodermis vessel (yellow dot) were selected. Blue dot indicates the position of the US A-line signal. The line plot shows the overlaid US and OA A-line signals, with the assumed dermis thickness of 200 µm indicated by gray area. c Segmented microvascular network in the dermal and hypodermal layers. d The same microvasculature as in (c) with color-coded sO2 levels.

