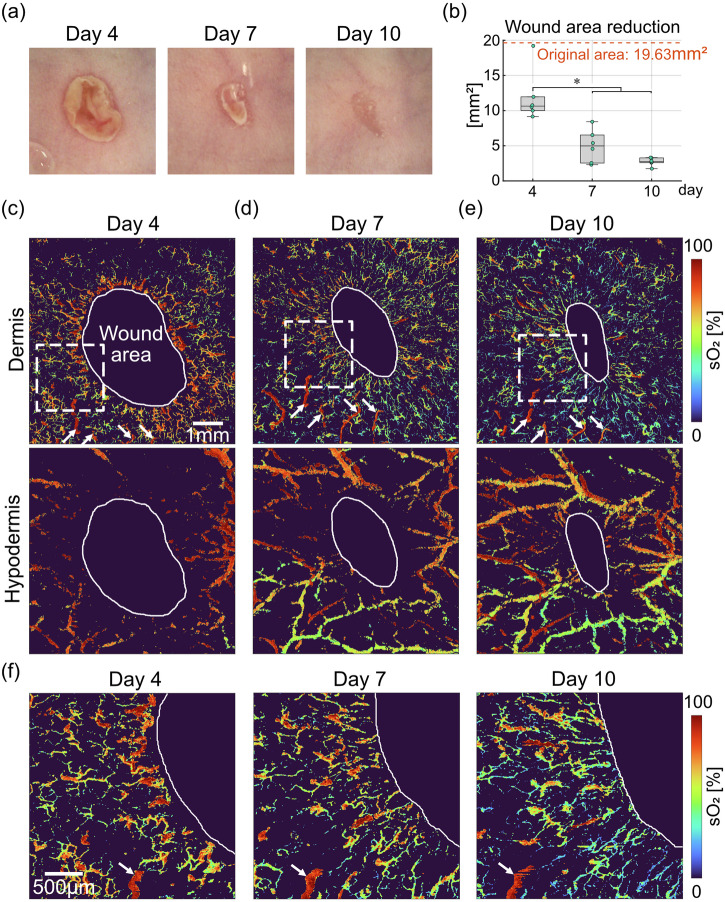
Fig. 3. Visual tracking of microvascular sO2 dynamics during dorsal skin wound healing.
a Photographs of the imaged wound taken at day 4, 7, and 10. b Quantification of wound area reduction over time (n = 6 wounds from 4 mice). Original wound area was calculated as the area of a 5 mm diameter circle. c–e Longitudinal monitoring of microvascular sO2 separately for the dermal and hypodermal layers. Wound areas were manually delineated as areas lack of OA signals and are indicated with white solid lines. White arrow heads indicate the same set of arterioles in the dermis visualized over time. The FOV for all images is 7 mm × 7 mm. f Zoom-in views of microvascular sO2 in the dermis close to the wound boundary at the locations indicated with white dashed boxes in (c)–(e). White arrow heads point to the same arteriole visualized over time. The FOV for zoom-in images is 2.5 mm × 2.5 mm. Asterisks (*) indicate significant differences (p < 0.05).

