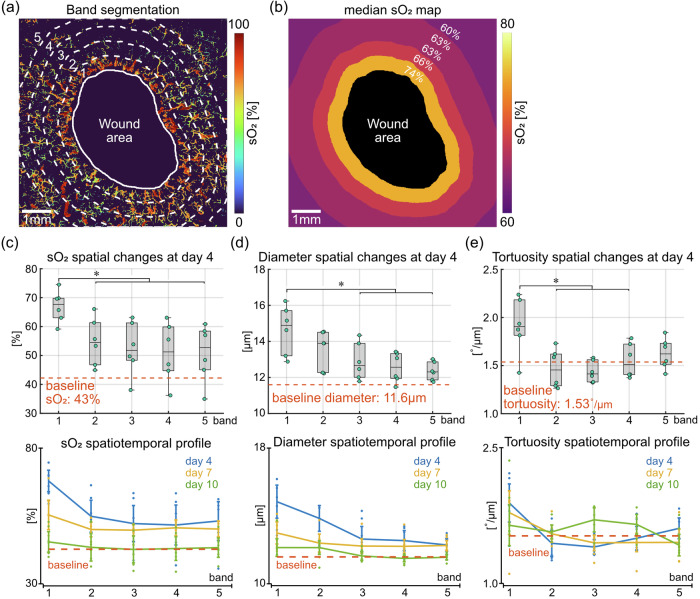
Fig. 4. Quantitative analysis of the spatial variations in microvascular parameters in the dermis.
a Segmentation of different spatial bands away from the wound boundary. Bands 1 to 4 are concentric to the wound boundary and have a width of 0.5 mm. Band 5 covers the remaining pixels outside band 4. The full FOV is 7 mm × 7 mm. b Heatmap with colors indicating median sO2 within each band. Pixel values within the wound area were discarded. c Spatial profile of microvascular sO2 changes. Box plot shows the spatial changes at day 4 (n = 6 wounds from 4 mice). Line plot presents an overview of the spatial changes at all time points. Baseline measurement was taken on healthy skin of the same group of mice. d Spatial profile of vessel diameter changes. e Spatial profile of vessel tortuosity changes. Asterisks (*) indicate significant differences (p < 0.05). Error bars in line graphs are defined as 95% confidence intervals.

