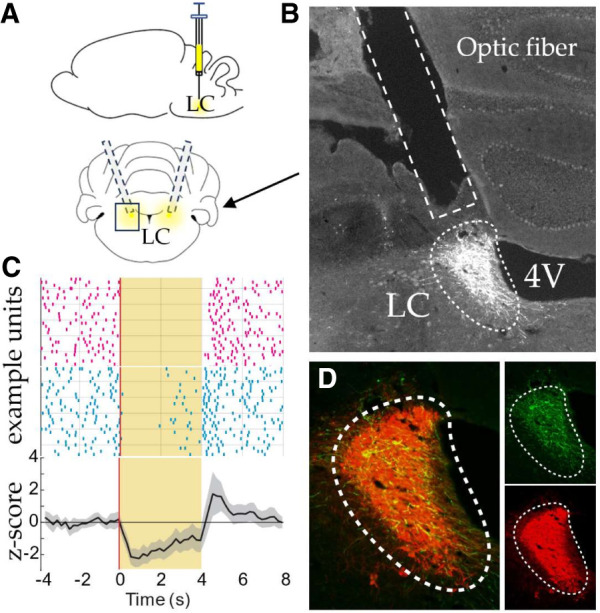
Figure 3.

Verification of viral efficacy. (A) Depiction of optic fibers placed bilaterally dorsal to the LC and a viral infusion. (B) The optic fiber tract is seen directly dorsal to the LC (hashed white outline, virus shown in white). (C) Noradrenergic LC neurons are inhibited during laser stimulation. Peri-stimulation raster plots from five LC neurons were recorded in one rat (example units). All exhibited a reduction in firing during laser stimulation (yellow background). Average z-score normalized firing rates across the population of cells. (D) Fluorescent tag eYFP (green) bound to the ArchT opsin, and dopamine-beta hydroxylase (red) can be seen in separate panels on the right. On the left, these images are merged to see the colocalization of the virus and DBH (yellow).
