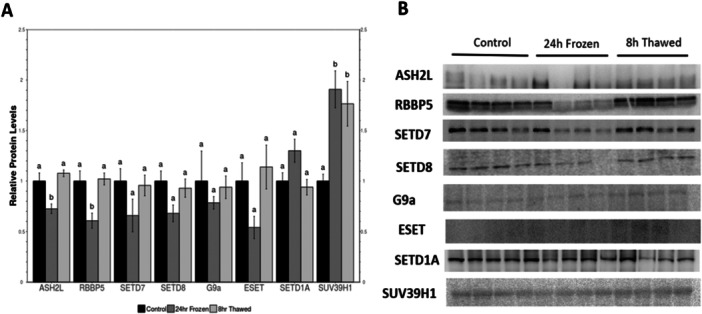
Figure 2.

Relative protein levels of lysine methyltransferases (KMTs) in Rana sylvatica kidney via western immunoblotting. (A) Histogram showing mean ± SEM (n = 4) standardized expression levels under control, 24 h freezing, and 8 h thawed conditions. For each protein target, values that share the same letter designations are not significantly different from one another, while values with different letter designations are significantly different (p < 0.05). (B) Representative western blots for individual targets under each experimental condition. Data were analyzed using a one‐way ANOVA with a Tukey's post hoc test.
