. 2024 Dec 1;25(4):334–341. doi: 10.30476/dentjods.2023.98834.2112
Copyright: © Journal of Dentistry
This is an open access article distributed under the terms of the Creative Commons Attribution 4.0 International License, ( http://creativecommons.org/licenses/by/4.0/ ) which permits reusers to copy and redistribute the material in any medium or format if the original work is properly cited, and attribution is given to the creator. The license also permits for commercial use.
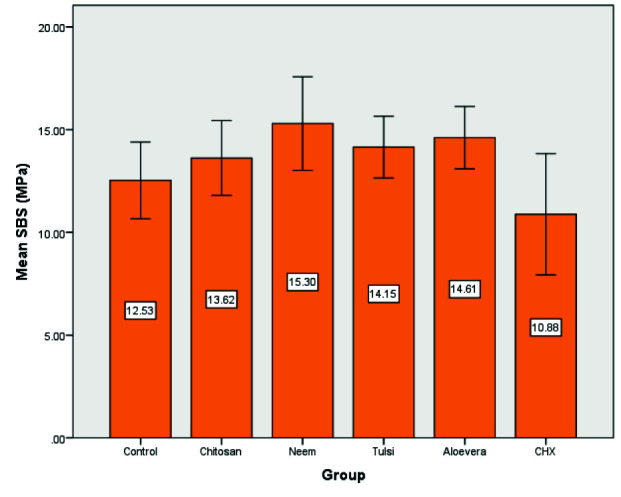
Figure 2.

bar plot illustrates mean of the SBS (MPa) in all groups
