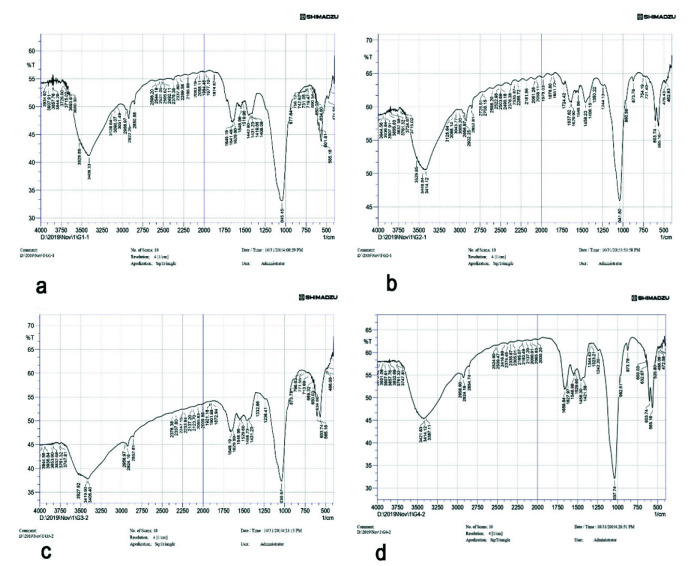
Figure 5.
FTIR intensity peaks for a: control group, b: nHAP group, c: ChinHAP, d: MS-nHAP. Intensity values ratio for the peak in area of 900–1200 cm-1 phosphate band and area of amide I band (1590–1720 cm-1) was taken for calculating mineral to matrix. Intensity ratio of CO3 band at 1415 and PO4 at 1030 subband was used to calculate the Carbonate-to-phosphate ratio (C/P) (hydroxy apatite nanoparticles (nHAP); chitosan+hydroxy apatite nanoparticles (chi-nHAP); mesoporous silica+ hydroxy apatite nanoparticles (MS-nHAP))

