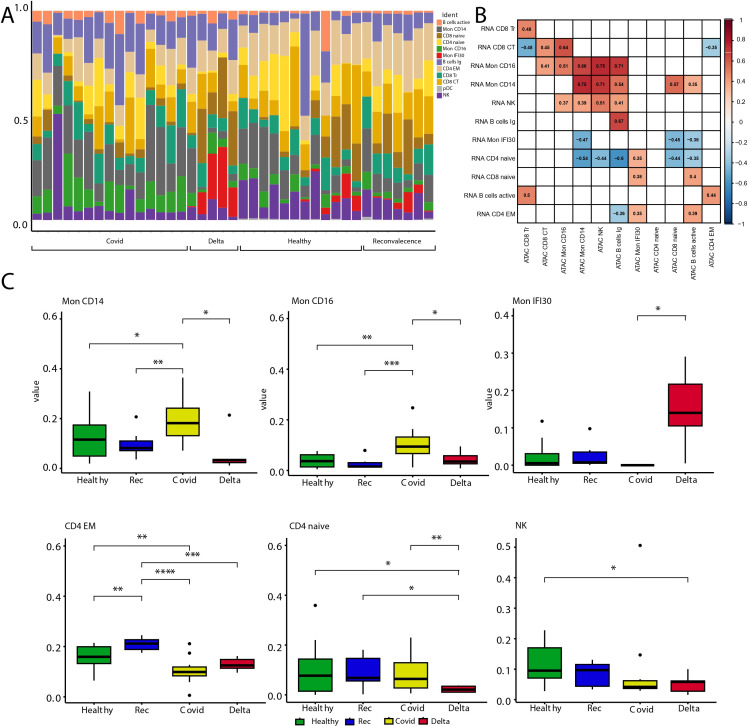
Figure 2.
Analysis of cell type abundance across the study cohorts. (A) Barplot with fractions of cell types across cohorts. (B) Heatmap showing Pearson correlation of scRNA-seq pseudobulk gene expression and approximated gene activity from scATAC-seq across cell types. Gaps are correlation values with low significance level (p-value >0.05). (C) Boxplots with cell fractions across the study cohorts. Pairwise comparisons were performed using Wilcoxon rank-sum test. Significant changes (adjusted p-values ) are shown with stars. * stands for p-value < 0.05; ** stands for p-value < 0.005; *** stands for p-value < 0.0005; **** stands for p-value < 0.00005.

