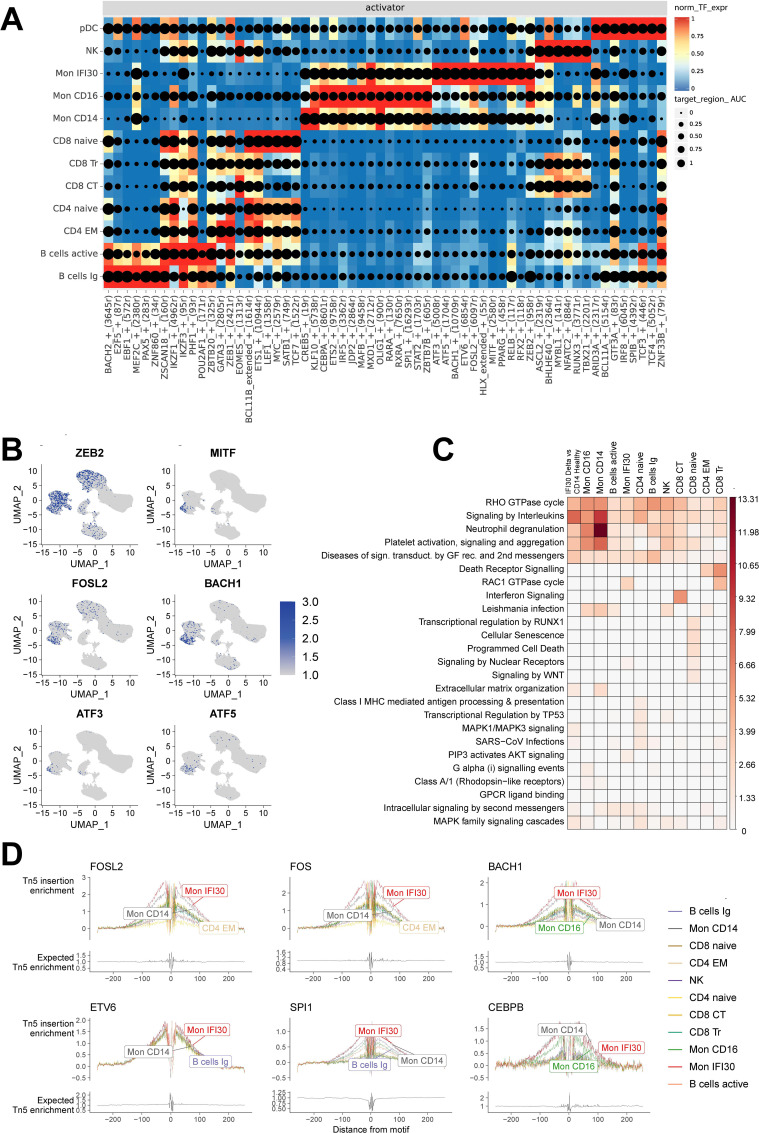
Figure 4.
Joint scRNA-seq/scATAC-seq analysis revealed the core transcriptional regulators in each cell state. (A) Heatmap/dotplot with TF expression of enhancer-driven regulons (color scale) considering the cell-type specificity of the regulons (dot size scale). (B) Pseudoexpression (estimated gene activity) of the core transcriptional regulators (ZEB2, MITF, FOSL2, BACH1, ATF3, and ATF5) in the Mon IFI30 cell state across all cells. (C) Enrichment of the Reactome Pathways for upregulated peaks between Delta COVID-19 and healthy individuals. The peaks were assigned to the closest gene. (D) Footprint profiles for Mon IFI30 regulators (FOSL2, FOS, BACH1, ETV6, SPI1, and CEBPB) across cell types.

