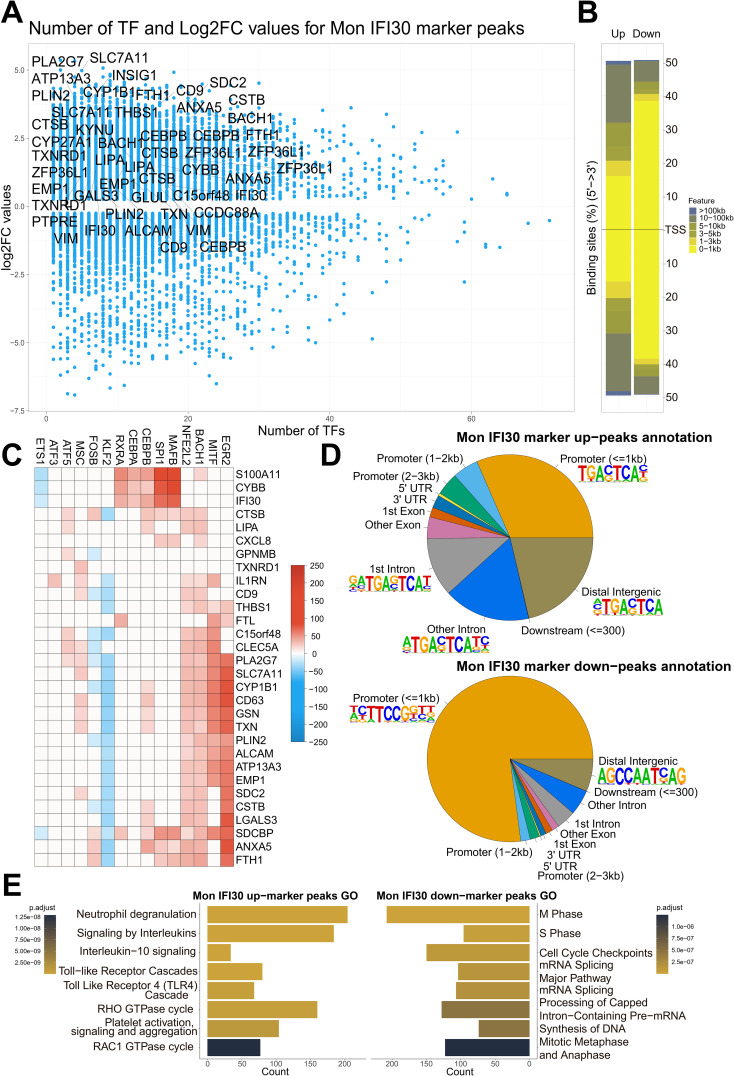
Figure 5.
Mon IFI30 cis-regulatory elements. (A) Scatterplot of the number of TFs operating in the Mon IFI30 marker peaks (as estimated using SCENIC+). The highlighted genes represent Mon IFI30 expression markers. (B) Barplot showing the distribution of the Mon IFI30 marker peaks around TSS. (C) Heatmap showing the contribution of transcription factors in the regulation of Mon IFI30 marker genes. (D) Distribution of Mon IFI30 marker peaks by UTRs, exons, introns, promoters, and distal intergenic locations. The top enriched motifs within each segment are highlighted with logos. (E) Enrichment of the Reactome Pathways for up/down marker peaks in Mon IFI30.

