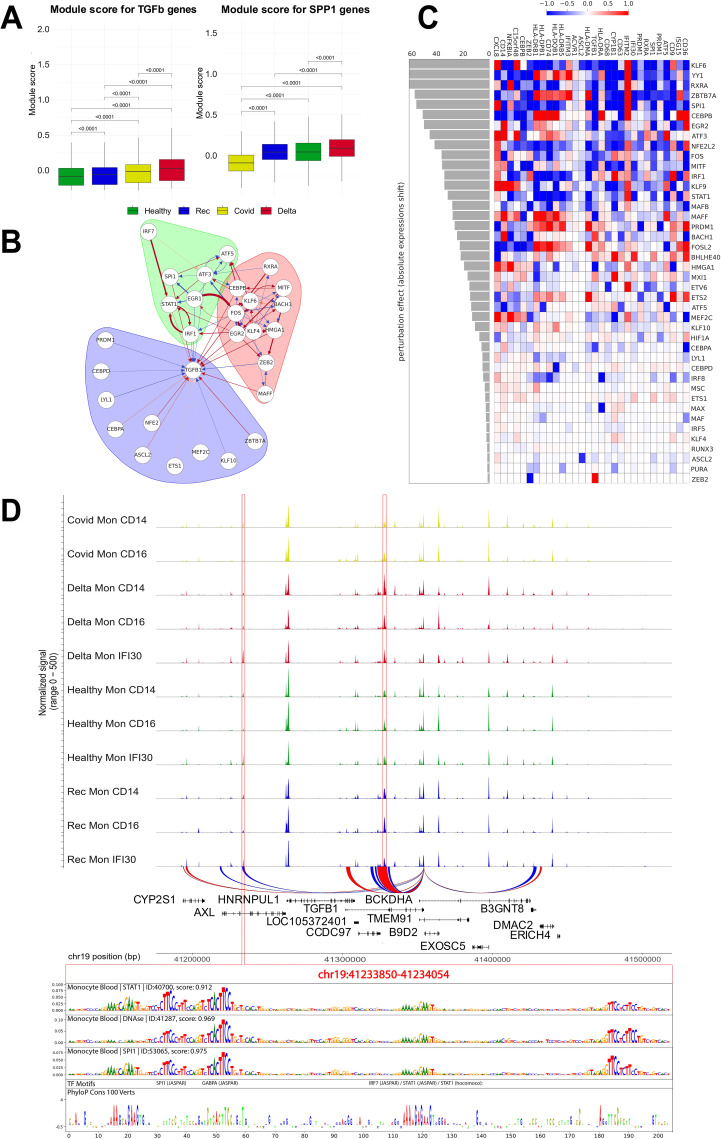
Figure 6.
TGF beta gene regulatory network and in silico perturbation of Mon IFI30 cell state regulators. (A) Boxplot with aggregated scores for TGF beta and SPP1 modules (obtained from the CellChat database). Significant differences are highlighted with p-values. Module score have been calculated for all monocytes (Mon CD14, Mon CD16, and Mon IFI30). (B) Gene regulatory subnetwork centered on TGFB1. Modules of the network were estimated using a community detection algorithm based on random walks. (C) Heatmap barplot with in silico perturbation of transcription factors in Mon IFI30. Barplot shows the absolute perturbation effect on the expression of Mon IFI30 marker genes in a single computational knockdown of a TF. (D) Chromatin accessibility signals across monocyte subtypes and cohorts. We identified two (highlighted with red frame) loci with significantly elevated chromatin openness in Mon IFI30, and distally located regions present exclusively in Mon IFI30 (left red frame). The DeepLift method highlights important regulatory nucleotides that overlap strongly with conserved sequences across mammalian positions.

