Figure 7.
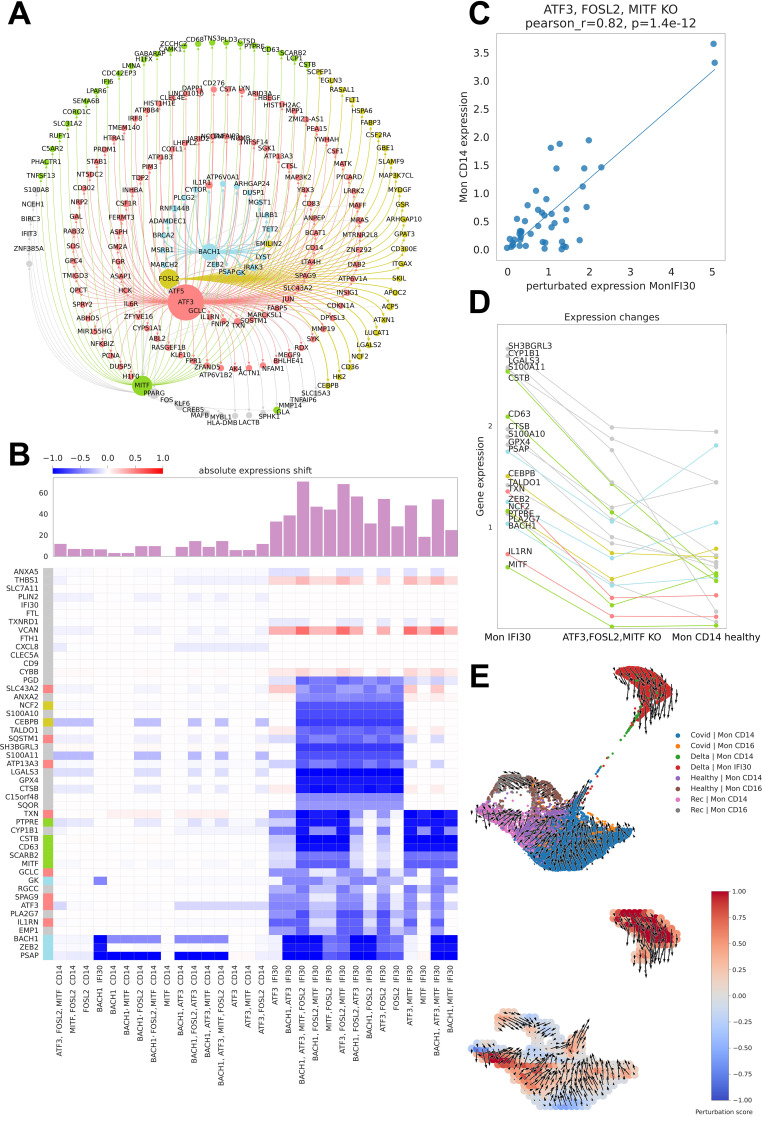
Master regulators of Mon IFI30 cell state. (A) Graph of the CellOracle gene network containing Mon IFI30 marker genes and core transcriptional regulators. The nodes are colored according to the regulatory TF. The size of a node reflects the number of incoming and outcoming connections for the regulators. (B) Heatmap with the TF perturbation response. The barplot on top of the heatmap shows an absolute expression shift across all genes for every perturbation. In silico perturbations for single or multiple TFs (mentioned at the bottom of the plot). (C) Scatterplot of in CD14 monocyte expression values predicted in Mon IFI30 after joint knockdown of FOSL2, MITF, and ATF3. (D) Lineplot showing changes in the expression of the Mon IFI30 marker genes after joint in silico knockdown of FOSL2, MITF, and ATF3. (E) UMAP plot of monocytes across the study conditions with the direction of the vector fields upon joint perturbation of the FOSL2, MITF, and ATF3 TFs.

