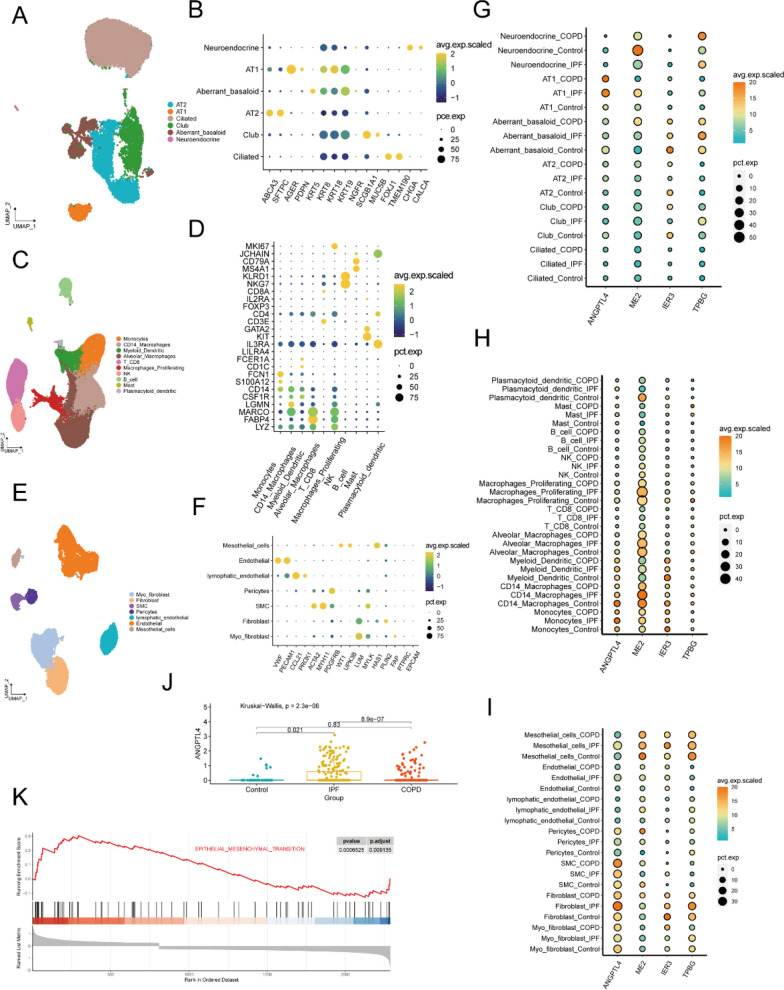
Fig. 6.
The mRNA expression of 4 selected genes in IPF at single cell level. UMAP plots showing the distribution of classical subpopulations of epithelial cells (A), immune cell (C) and stromal cells (E). Dot plots showing the expression of marker genes corresponding to epithelial cell subpopulations (B), immune cell subpopulations (D) and stromal cell subpopulations (E). The mRNA expression of 4 selected genes in epithelial cell subpopulations (G), immune cell subpopulations (H) and stromal cell subpopulations (I). The expression of ANGPTL4 in PMCs (J). MMT is activated in PMCs of IPF when compared with healthy control (K)

