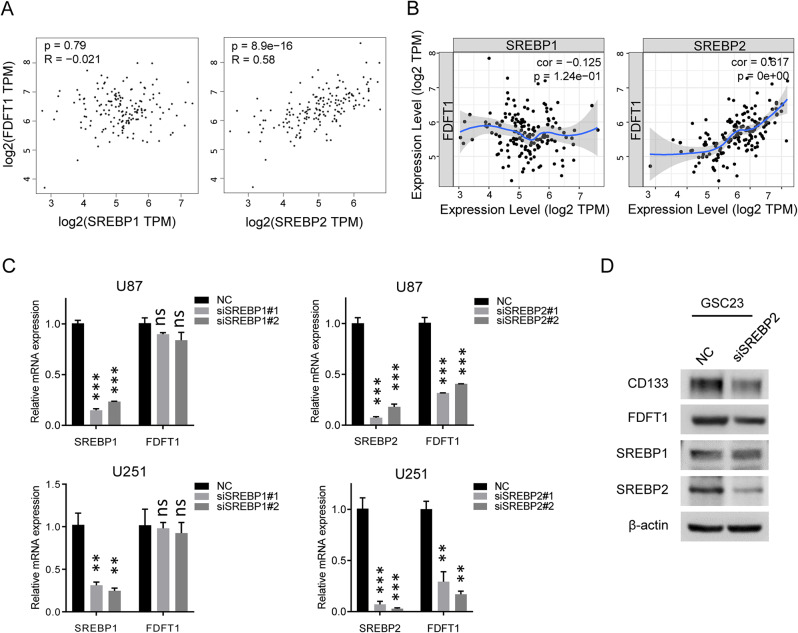
Fig. 6.
Correlation Between SREBPs and FDFT1. (A) GEPIA database analysis illustrating the expression correlation between SREBP1/2 and FDFT1. (B) TIMER database analysis demonstrating the expression correlation between SREBP1/2 and FDFT1. (C) qPCR results showing the mRNA expression levels of FDFT1 following the knockdown of SREBP1/2. (D) Western blot (WB) results indicating the protein expression levels of FDFT1 upon SREBP2 knockdown in GSC23 cells. Abbreviations: ns, not significant; *, p < 0.05; **, p < 0.01; ***, p < 0.001

