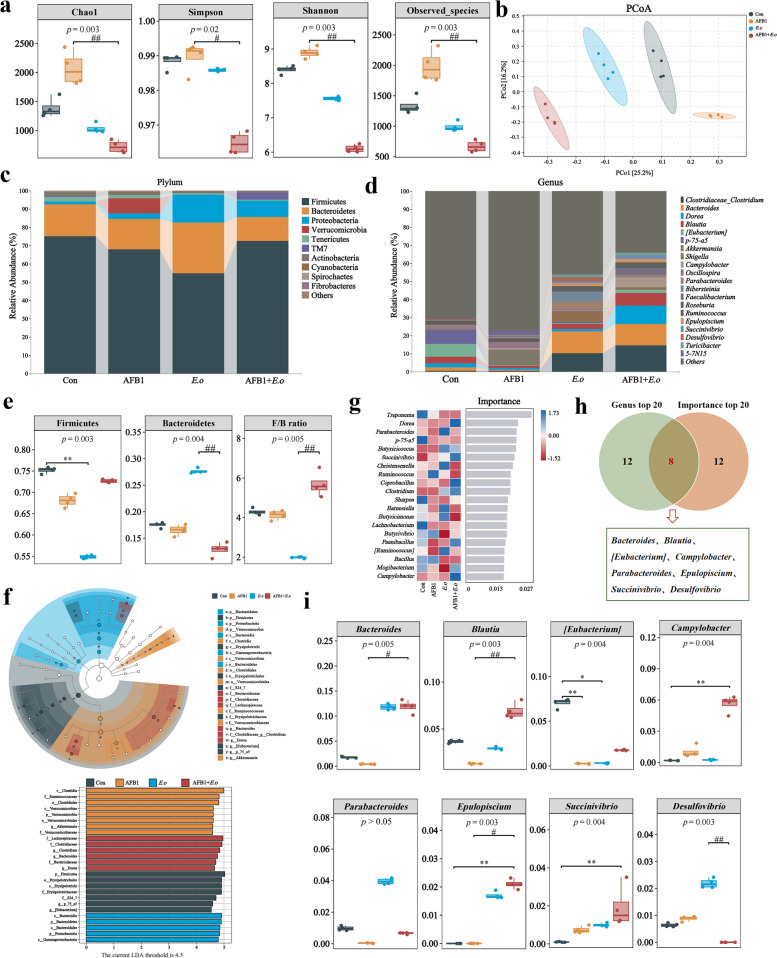
Fig. 3.
AFB1 and coccidia exposure altered the intestinal microorganisms of sheep. a Alpha diversity index. Chao1 and Observed species indices characterize richness, while diversity is assessed using Shannon and Simpson indices. b Principal coordinates analysis (PCoA) was performed to calculate beta diversity on a distance matrix of Bray–Curtis indices. c Changes of intestinal microbial composition at the phylum level (TOP 10). d Abundance analysis of the gut microbiota at the genus level (TOP 20). e Relative abundance of Bacteroidetes, Firmicutes, and F/B ratio. f Linear discriminant analysis effect size (LEfSe) comparison analysis between the groups. g Random Forests analysis (top 20 at the genus level). h Venn diagram analysis of differential genera. The differential genera screened by the top 20 genera and the importance top 20 genera from Random Forest analysis are presented in a Venn diagram, with the coincidence part indicating the potential biomarkers. i Relative abundance analysis of common differential genera. The groups were compared by the Kruskal–Wallis nonparametric test, and the two groups were compared by Dunn’s test. *p < 0.05, **p < 0.01, and ***p < 0.001 (AFB1, E.o, and AFB1+E.o vs Con); or #p < 0.05, ##p < 0.01, and ###p < 0.001 (AFB1+E.o vs AFB1 and E.o)(n = 4)

