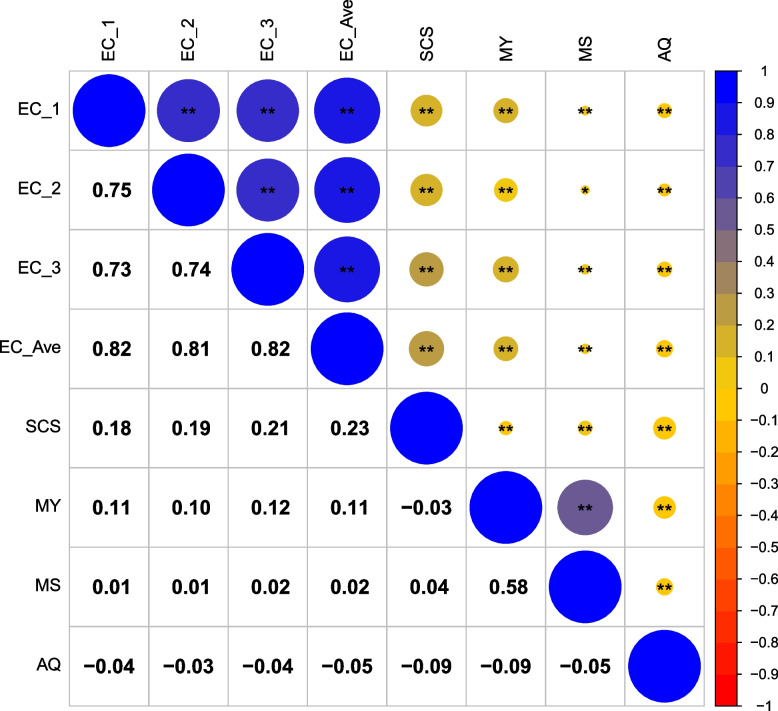
Fig. 1.
The phenotype correlation between electrical conductivity and milk production-related traits of Chinese Holstein dairy cows. Note: EC_1 = the EC at the first milking session in a day; EC_2 = the EC at the second milking session in a day; EC_3 = the EC at the third milking session in a day; EC_ave = the daily average EC; SCS = somatic cell score of the milk; MY = the milk production yield; MS = the average milk speed in a day; AQ = the activity quantity of each cow in a day. The lower left corner is the relevant value, the upper right corner is the corresponding color expression, and the asterisks indicate significant correlation between two traits (*. p < 0.05 and **. p < 0.01)

