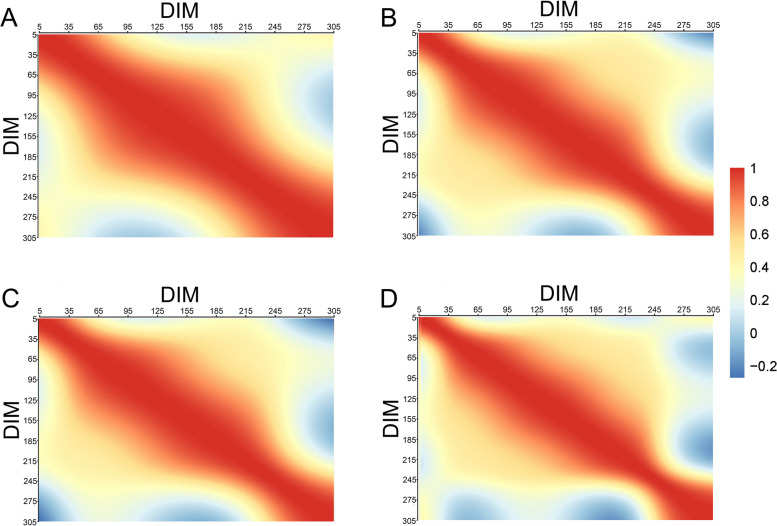
Fig. 5.
The permanent environmental correlations of EC within the lactation of dairy. Note: A = the permanent environmental correlations of EC at the first milking session in a day (EC_1); B = the permanent environmental correlations of EC at the second milking session in a day (EC_2); C = the permanent environmental correlations of EC at the third milking session in a day (EC_3); D = the permanent environmental correlations of the daily average EC (EC_ave). The red and blue color gradients represent the magnitude of the correlation

