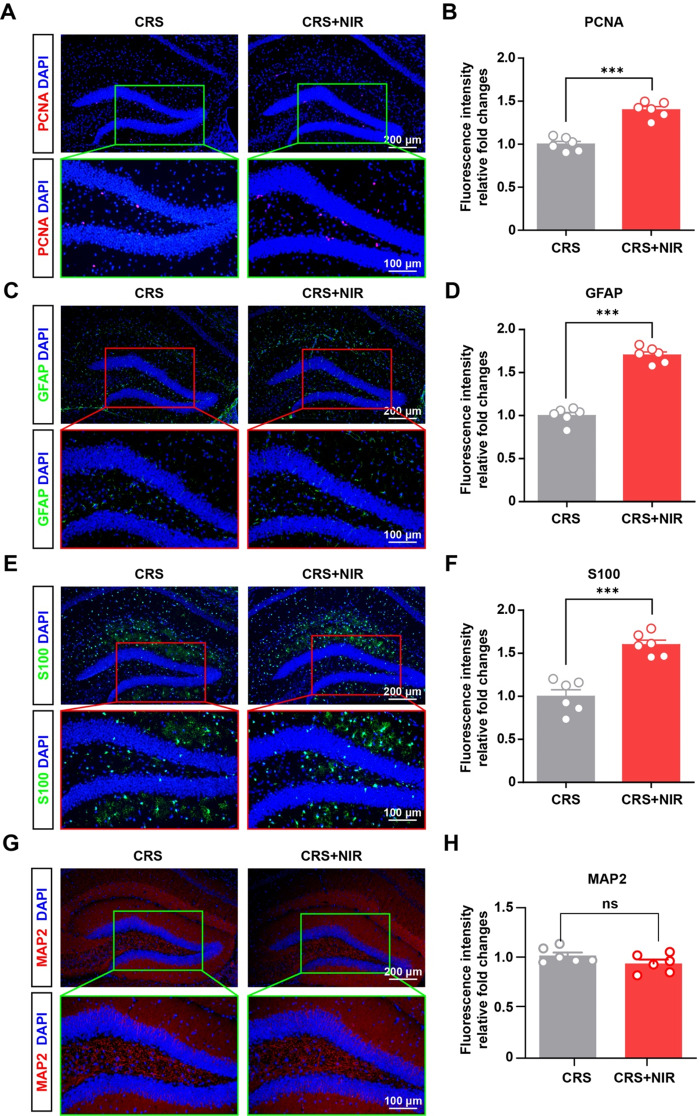
Fig. 2.
Glial expression in the hippocampus of CRS mice after NIR treatment. (A) Representative image of immunohistochemical staining for PCNA in the non-stimulated and stimulated DG regions of CRS mice. (B) Relative intensity value of fluorescence after homogenization (CRS: n = 3; CRS + NIR: n = 3; two slices per mice). (C) Representative images of immunofluorescence staining of GFAP in the non-stimulated and stimulated DG regions of CRS mice. (D) Relative intensity value of fluorescence after homogenization (CRS: n = 3; CRS + NIR: n = 3; two slices per mice). (E) Representative image of immunohistochemical staining for S100 in the non-stimulated and stimulated DG regions of CRS mice. (F) Relative intensity value of fluorescence after homogenization (CRS: n = 3; CRS + NIR: n = 3; two slices per mice).Values represent mean ± SEM, ***p < 0.001. (G) Representative image of immunohistochemical staining for MAP2 in the non-stimulated and stimulated SGZ regions of CRS mice. (H) Relative intensity value of fluorescence after homogenization (CRS: n = 3; CRS + NIR: n = 3; two slices per mice).Values represent mean ± SEM, ***p < 0.001

