
Fig. 5.
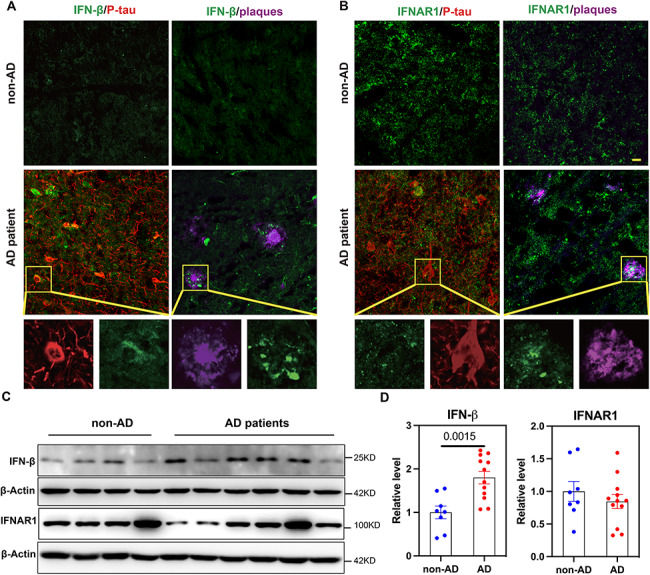
Expression of IFN-β and IFNAR1 in AD patients’ brain tissues. Examination of IFN-β and IFNAR1 in AD and non-AD patients’ brain specimens. Amyloid plaques are stained with Aβ (6E10, magenta) and neurofibrillary tangles with P-tau (AT8, red). Representative amplified confocal images of (A) IFN-β (green) widespread expression in neurofibrillary tangle and plaque regions; (B) IFNAR1 (green) expressed in neurofibrillary tangle and plaque regions; Scale bar: 20 𝛍m. (C) Western blot for IFN-β, IFNAR1 and β-Actin using brain tissue lysates from AD patients (n = 12) and non-AD patients (n = 8). (D) Ratio of IFN-β and IFNAR1 to β-Actin from C. Data are reported as mean ± SEM. Data are analyzed by two-tailed unpaired t-test