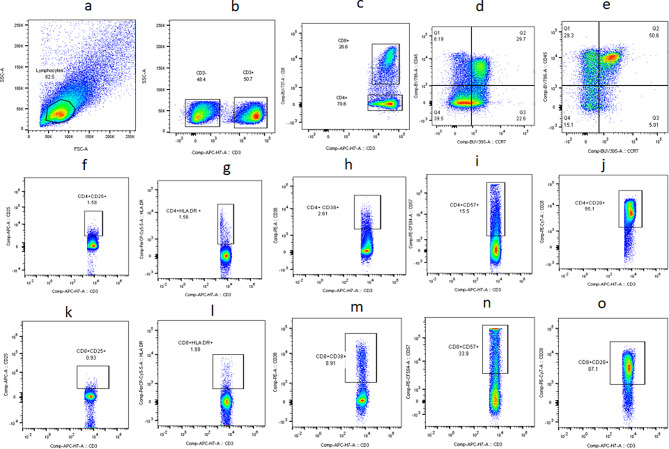
Fig. 1.
Gating strategy: Representative flow cytometry plots showing gating strategy used for analysis of the flow assays. Lymphocytes identified by forward and side scatter (a) were further gated for identification of CD3, CD4 and CD8 T cells (b, c). Maturation phenotypes of CD4 and CD8 T cells were identified based on CCR7 and CD45RA expression (d, e). All other markers were plotted on CD4 (f-j) and CD8 (k-o) T cells as shown in the plots. FMT controls which is full minus 3 were used to distinguish the population in the gating strategy. FMT controls were stained with surface markers for T cells. Gated CD3, CD4 and CD8 T cells, unstained for other markers, were further used for placing the gates

