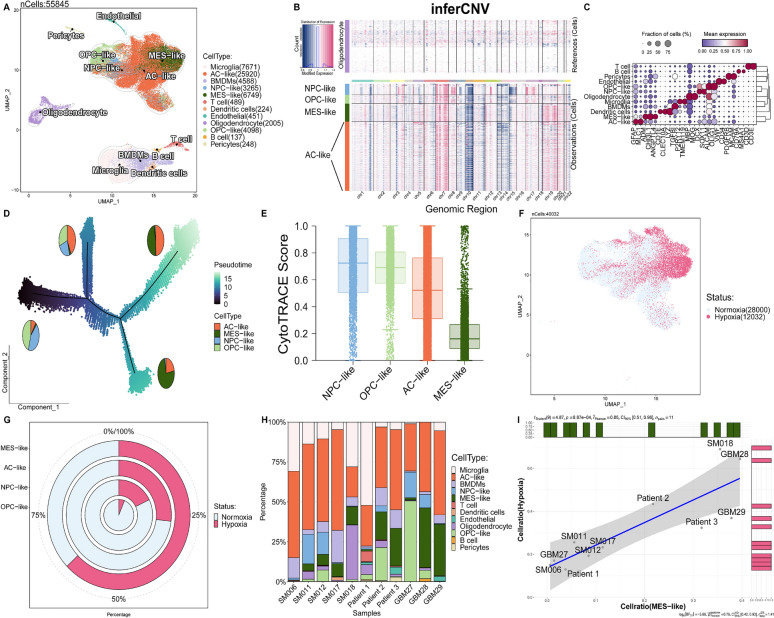
Fig. 2.
Determining the tumor evolution and hypoxia specificity of MES-like malignant cells. A Integration of 11 human GBM scRNA-seq data collected from three individual datasets by BBKNN. A total of 55845 cells were analyzed using UMAP. B Inference of copy number variation analysis shows the chromosome 7 gain and chromosome 10 loss in tumor cells compared with normal cells. C Dot plot displays the represented markers for each major cell cluster. D Pseudotime analysis demonstrates a major transition starting from OPC- and NPC-like to AC- and MES-like cells. Pie charts demonstrate the proportions of each cell type in GBM. E Box plot demonstrate the CytoTRACE score of each cell type. F-G The distribution and proportion of predicted hypoxic cells across different cell types. H The distribution of cell populations in each patient is depicted, with cell types color-coded to correspond to those in the UMAP plot. I The correlation between the proportion of hypoxic cells and the proportion of MES-like cells in tumor cells from each sample

