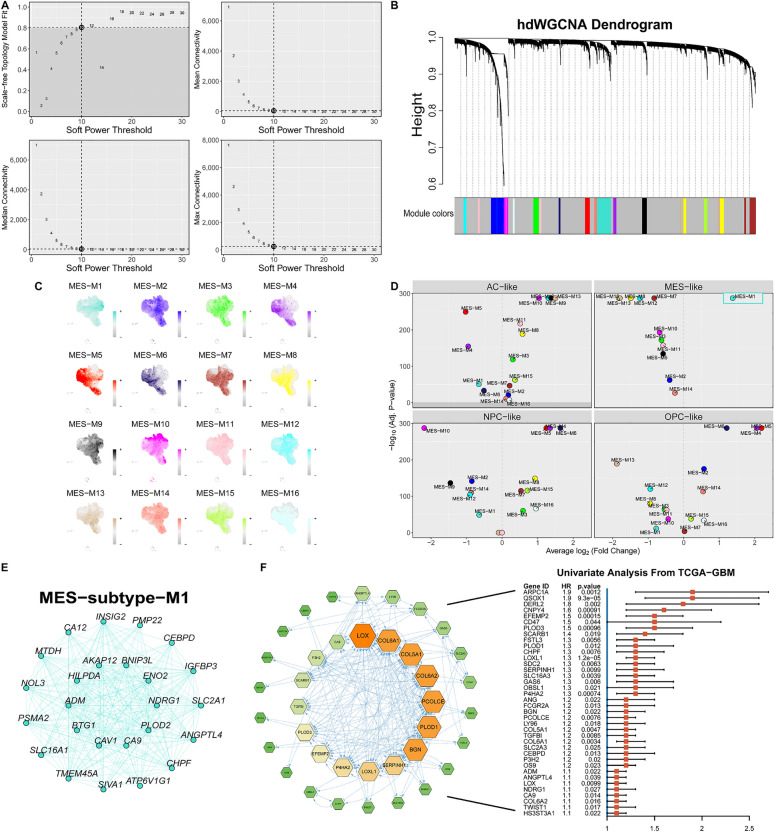
Fig. 3.
The identification of a core detrimental gene set in MES-like cells. A The scale-free topology model was employed to fit the minimum soft power threshold, which was greater than or equal to 0.8, thereby making the constructed network more aligned with the principles of scale-free topology. B Utilizing the optimal soft threshold, a co-expression network is constructed whereby genes are categorized into distinct modules, culminating in the creation of a gene dendrogram. The upper section displays the gene hierarchical clustering tree, whereas the lower section comprises the gene modules, also referred to as network modules. C Gene scores for each module were computed using the UCell algorithm. D Volcano plots of iterative one-versus-all differential module eigengene test results for the four subtypes of tumor cells. E The top 25 important genes of Module 1. F The left figure represents the gene network diagram obtained after protein–protein interaction and univariate Cox regression screening, while the right figure is the forest plot of the univariate Cox regression of each gene

