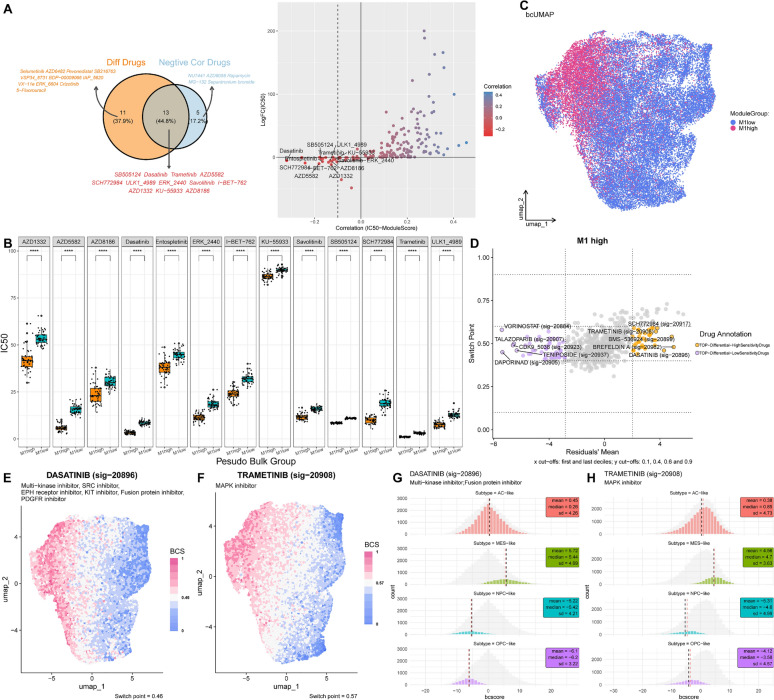
Fig. 5.
Potential MES-like GBM specific therapeutic agents: Trametinib and Dasatinib. A The left graph is a Venn diagram, where the intersection represents drugs that meet both screening criteria; the right graph is a scatter plot, where each point represents a drug, the x-axis represents the correlation between IC50 and M1 scores, and the y-axis represents the logFC from the differential analysis of the pseudo-bulk high and low M1 groups. The dashed line is located at −0.1. B Boxplot of IC50 for 13 kinds of drugs in the pseudo-bulk high and low M1 groups. C Beyondcell UMAP of tumor cells grouped by high and low M1. D The 4 squares plot is a scatter plot of the residual mean and the switch point of the high M1 group cells. The left and right sides respectively display the drugs with low/high sensitivity to selected cells. E–F Evaluating the drug sensitivity of tumor cells to Dasatinib and Trametinib based on Beyondcell. G-H Histogram of bc score distribution for 4 subtypes of tumor cells

