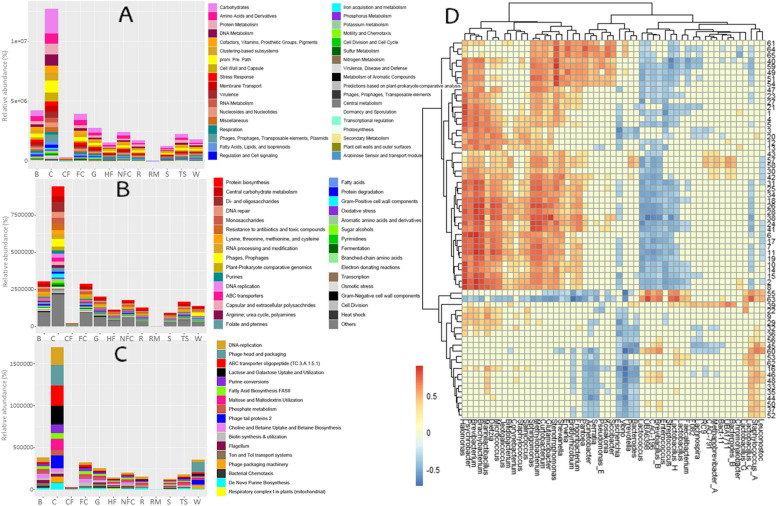
Fig. 4.
Functional potential of Latxa raw ewe milk, whey, Idiazabal cheese, and environmental samples. Bar chart representation of metabolic pathways at subsystem level 1 (A), and main metabolic pathways at subsystem level 2 (B) and 3 (C), and correlation heatmap between selected food quality and safety metabolic pathways and key bacterial general resulted from OPLS model (D). Abbreviations: B: brine, C: cheese, CF: commercial feed, FC: food contact surfaces, G: grass, HF: home-made feed, NFC: non-food contact surfaces, R: rennet, RM: raw milk, S: straw, TS: teat skin surface, W: whey. The numbers on the heat map correspond to abbreviations of the metabolic pathways detailed in Supplementary Table S6

