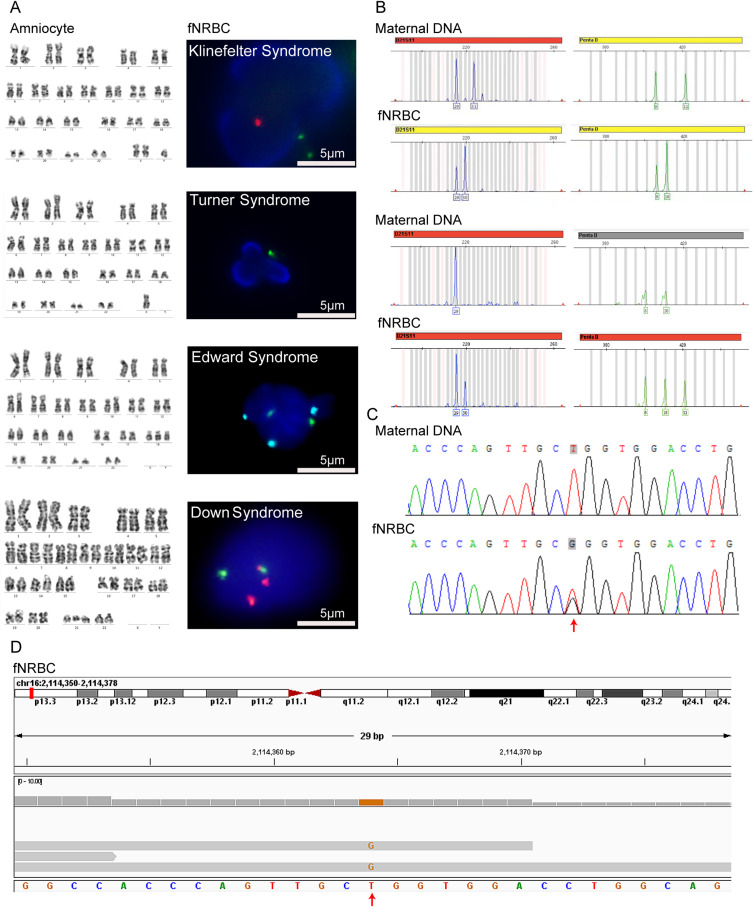
Figure 6.
(A) Representative images for diagnosing fetal chromosome aneuploidy using FISH analysis of isolated fNRBCs from maternal peripheral blood. Red fluorescence represents chromosomes 21 and Y, green represents chromosomes 13 and X, and cyan represents chromosome 18 (scale bar = 5 μm). All results were consistent with amniocentesis karyotype results. (B) Representative images for diagnosing fetal trisomy 21 using QF-PCR analysis of isolated fNRBCs from maternal peripheral blood. (C) Sequencing results of candidate fNRBCs from a pregnancy affected by Bourneville disease. The results suggested that the fetus harbors a heterozygous c.1535T > G mutation in the TSC2 gene, while the mother is unaffected. The arrow indicates the location of the variant. (D) WES of candidate fNRBCs in the above cases suggested the presence of the c.1535T > G mutation in the same gene.

