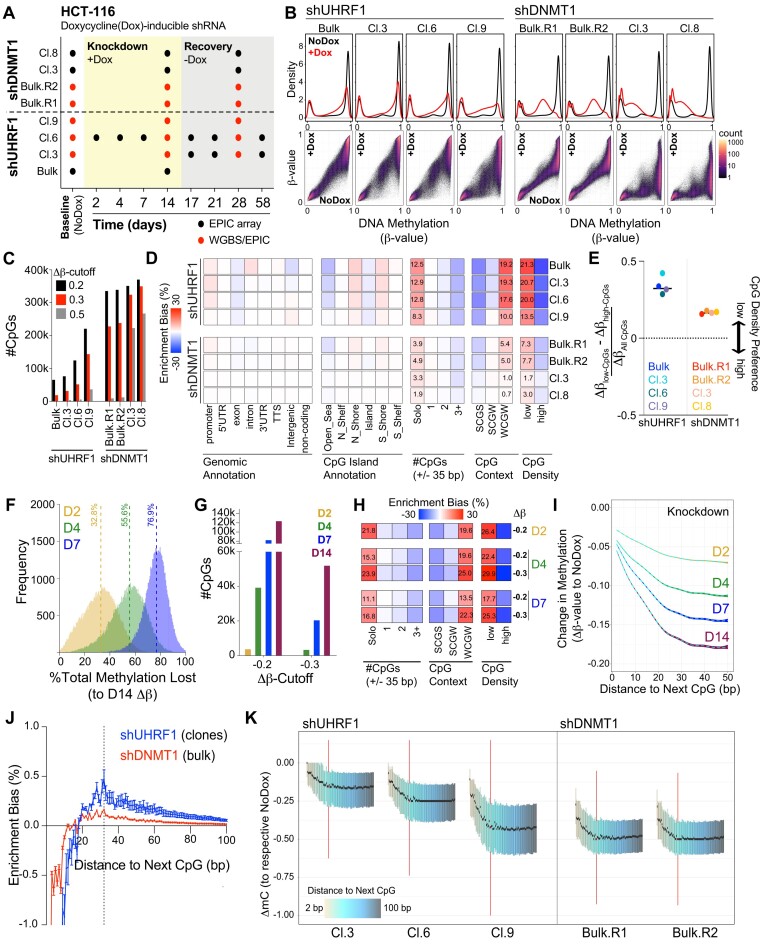
Figure 1.
Low-density CpGs are most prone to DNA hypomethylation when UHRF1 levels are reduced. (A) Schematic of experimental design including samples, time-points, and types of DNA methylation data collected. (B) DNA methylation distributions of EPIC array probes from dox-inducible shRNA HCT116 cell lines without (black) and with (red) dox treatment (10 ng/ml) for 14 days. Top panel: Density plots for CpG probe distribution across DNA methylation levels [β-value: 0 (unmethylated) to 1 (methylated)]. Bottom panel: Density scatterplots demonstrating density of probes and DNA methylation level in baseline (x-axis) and knockdown (y-axis) methylomes. (C) Bar graph for number of differentially mCpGs (EPIC array) for each knockdown experiment (β-valueBaseline 0.85; varying Δβ-valueKnockdown cutoffs relative to each respective Baseline sample). (D) Hypergeometric analysis of significantly hypomethylated CpGs for each sample from 1C. Positive values indicate significant overrepresentation for hypomethylation of the feature and negative values indicate significant underrepresentation. Enrichment bias values are provided for the most significant positive enrichments. #CpGs indicates the number of CpGs
  35 bp upstream and downstream of the hypomethylated CpG. CpG Context represents the −1/+1 position nucleotide (S = C or G; W = A or T) flanking the hypomethylated CpG. CpG density is determined by the number of bps to the next CpG (either upstream or downstream). Low density
  20 bp, high density < 20 bp. (E) Normalized preference for CpG density among the shUHRF1 and shDNMT1 samples. ‘CpG density preference’ is calculated by subtracting the average Δβ-value of all the high-density CpGs (EPIC) from the average Δβ-value of the low-density CpGs, divided by the total Δβ-value of all CpGs. As this is a sample-dependent calculation, the difference in the numerator (Δβlow_density CpGs – Δβhigh_denisty CpGs) informs on which CpG density is most hypomethylated relative to all hypomethylated CpGs, where negative values indicate high-density CpG preference and positive values indicate low-density CpG preference. (F) Histogram of the calculated percent methylation lost [(β-valueKnockdown(X) – β-valueBaseline)/Δβ-valueKnockdown(Day14)]*100 across early time points (X = Days 2, 4, 7) for all significantly hypomethylated CpGs in shUHRF1 knockdown (Cl.6) from 1C. Median % Methylation Lost is indicated by the dotted line for each time point. (G) Bar graph for number of differentially mCpGs (β-valueBaseline
 0.85, varying Δβ-valueKnockdown cutoffs relative to Baseline) across the early time-points in shUHRF1 knockdown (Cl.6). (H) Hypergeometric analysis of significantly hypomethylated CpGs (from 1G) across the early shUHRF1 (Cl.6) time-points. Legend from 1D applies. (I) Average loss of DNA methylation for all highly methylated CpGs (β-valueBaseline
 0.85) across ‘Distance to the Next CpG’ binning. Dotted line indicates the average Δβ-value as a function of distance, colored boundaries indicate 95% confidence intervals. (J) Hypergeometric analysis of significantly hypomethylated CpGs (WGBS) for each sample across CpG binning by ‘Distance to the Next CpG’ (bp). Positive enrichment bias indicates overrepresentation, negative enrichment bias indicates underrepresentation. Dotted line indicates peak positive enrichment bias for all shUHRF1 clones at 32 bp. (K) Boxplots for change in methylation (ΔmCKnockdown) of all highly methylated CpGs (mCBaseline
 0.85) from WGBS of each indicated sample across CpG binning by ‘Distance to the Next CpG’. The 32 bp boxplot (peak enrichment bias from 1J) is highlighted. Whiskers were removed for figure clarity. See alsoSupplementary Figure S1.

