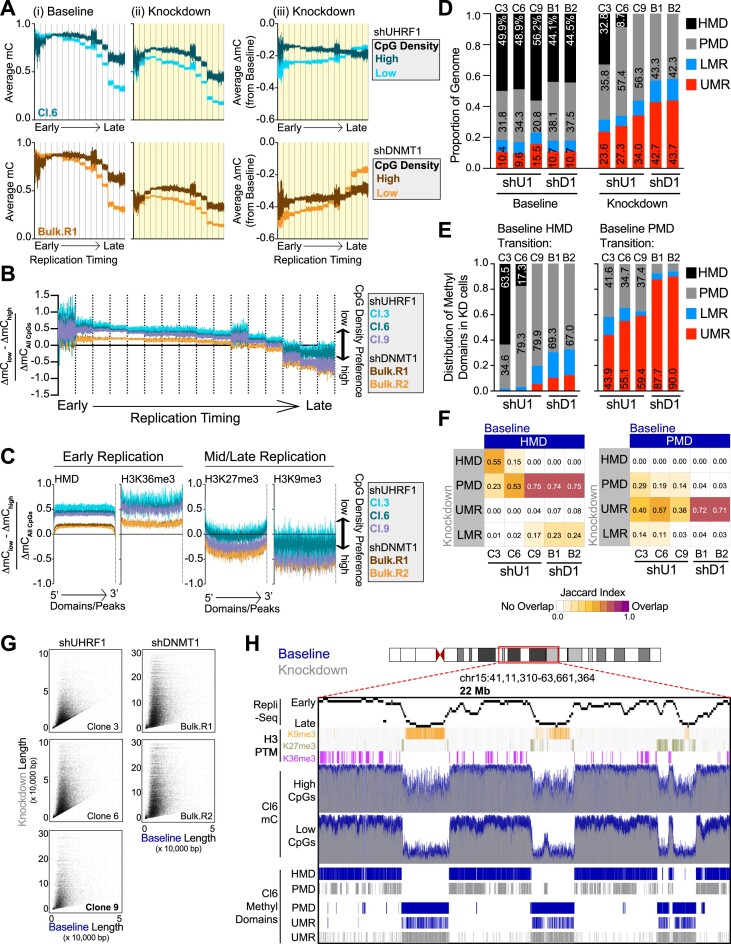
Figure 2.
Hypomethylation of low-density CpGs in the absence of UHRF1 and DNMT1 reshapes the DNA methylome. (A) Average DNA methylation (mC) of high and low density CpGs in (i) Baseline and (ii) Knockdown phases and the (iii) average change in methylation (ΔmCKnockdown) across each replication timing phase (16-phase) in HCT116 cells. Replication timing phases are assigned in 50 kb windows genome-wide, and the average DNA methylation (from WGBS) is calculated in 100 bp bins from the start of the 50 kb window to the end for each timing phase. Vertical lines indicate the separation of the different replication timing phases from early to late. shUHRF1 Cl.6 and shDNMT1 Bulk (replicate 1) samples are provided in the main figure. Remaining WGBS samples are presented in Supplementary Figure S2A. (B) Normalized preference for CpG density in shUHRF1 and shDNMT1 samples across replicating timing phases. ‘CpG Density Preference’ is calculated by subtracting the average ΔmC of all the high-density CpGs (WGBS) from the average ΔmC of the low-density CpGs, divided by the total ΔmC of all CpGs in 100 bp bins as described in 2A. Positive values indicate preference for low-density CpGs and negative values for high-density CpGs. (C) Normalized preference for CpG density in shUHRF1 and shDNMT1 samples across genomic features known to be localized in early replicating chromatin (HMDs, H3K36me3) and mid/late replicating domains (H3K27me3/H3K9me3). DNA methylation is averaged from the 5′ end of the Domain/Peak to the 3′end in size normalized windows. (D) Proportional coverage of the genome for called Methylation Domains in the Baseline and Knockdown stage for each shUHRF1 and shDNMT1 WGBS sample. HMD, highly methylated domain; PMD, partially methylated domain; LMR, lowly methylated region; UMR, unmethylated region. Baseline mC distributions for methylation domains are provided in Supplementary Figure S2C. (E) Distribution shift of called Methylation Domains in the Knockdown methylome from Baseline HMDs (left) and PMDs (right). (F) Overlap analysis of called Methylation Domains from Baseline and Knockdown methylomes across shUHRF1 and shDNMT1 WGBS samples. The Jaccard Index measures the extent of the overlap with 0 being no overlap to 1 being complete overlap. (G) Scatterplot of UMR length in Baseline methylomes versus Knockdown methylomes. Over 90% of the UMRs located within Baseline PMDs expand with loss of UHRF1 and DNMT1. (H) Browser shot of 22 Mb region on Chr15 demonstrating the observations made from WGBS sequencing analysis of Baseline and Knockdown methylomes in the shUHRF1 Cl.6 sample integrated with Repli-Seq, histone PTMs, and locality of called methylation domains. See alsoSupplementary Figure S2.

