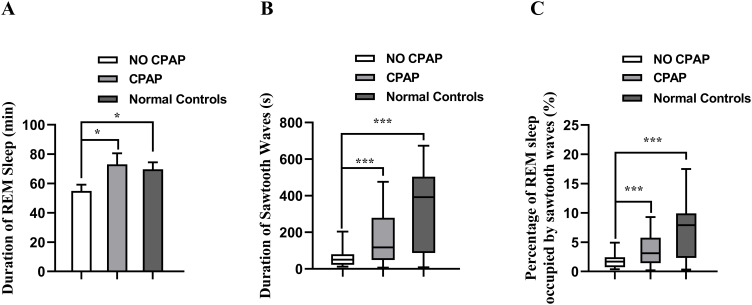
Figure 1.
Comparison of the duration of REM sleep (A), duration of sawtooth waves (B) and percentages of REM sleep occupied by sawtooth waves (C) in the OSA patients and normal controls. Data with a normal distribution are expressed as mean +SEM, and examined with paired t-test (No CPAP vs CPAP) or Student’s t-test (Normal controls vs CPAP/No CPAP) (A), and data with a skewed distribution are shown as median (minimum-maximum) and examined with Wilcoxon signed rank test (No CPAP vs CPAP) or Wilcoxon rank-sum test (Normal controls vs CPAP/No CPAP) (B and C), *P < 0.05, ***P < 0.001.

