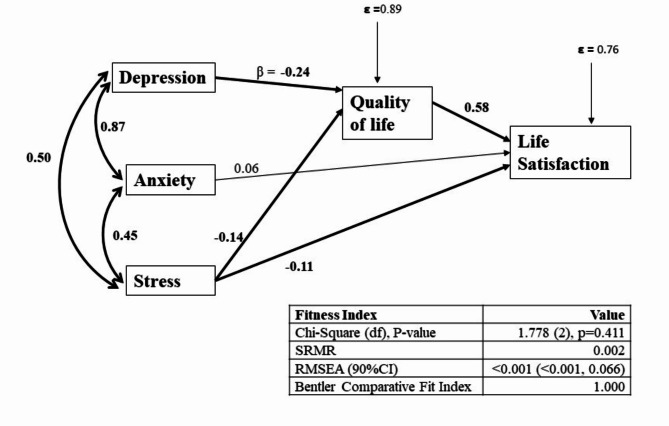
Fig. 1.
Pathway between depression, anxiety, stress, quality of life and life satisfaction (final model). Single-headed arrows indicate directional relationships, showing the hypothesized influence of one variable on another. Bold arrows highlight pathways found to be statistically significant in the path analysis. The final model is adjusted for age, ethnicity, marital and educational status, and family dependency for daily activities. β (Beta) represents the standardized regression coefficient, indicating the strength and direction of the relationship between the variables. Positive values indicate a direct relationship, while negative values indicate an inverse relationship. ε (Epsilon): Denotes the error term, which accounts for the unexplained variance in quality of life and life satisfaction. Fitness Index Values: Chi-Square tests the fit of the model to the data, with a non-significant p-value suggesting good model fit. SRMR (Standardized Root Mean Square Residual) indicates the average discrepancy between observed and predicted correlations, with values closer to 0 showing a better fit. RMSEA (Root Mean Square Error of Approximation) reflects the model’s goodness-of-fit, with values < 0.05 indicating a close fit. Bentler Comparative Fit Index compares the model’s fit to a baseline model, with values closer to 1 indicating a better fit

