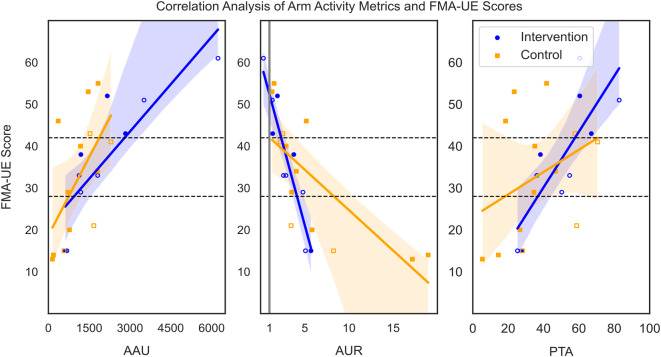
Fig. 4.
Datapoints of the subset (n = 23) and linear regression models with 95% confidence intervals (shaded area) from the intervention (n = 10, blue, circle) and control (n = 13, orange, square) groups to visualize the relationship between the FMA-UE scores and affected arm use (AAU), arm use ratio (AUR) and percentage of time active (PTA) during the first week of the study, respectively. Full squares/ circles represent participants that have their non-dominant hand affected, empty squares/circles participants that have their dominant hand affected. The black dashed horizontal lines indicate the different impairment levels. The grey vertical line in the middle plot indicates an equal ratio of affected and less affected arm use (1:1). FMA-UE = Fugl-Meyer Assessment – Upper Extremity Subscale

