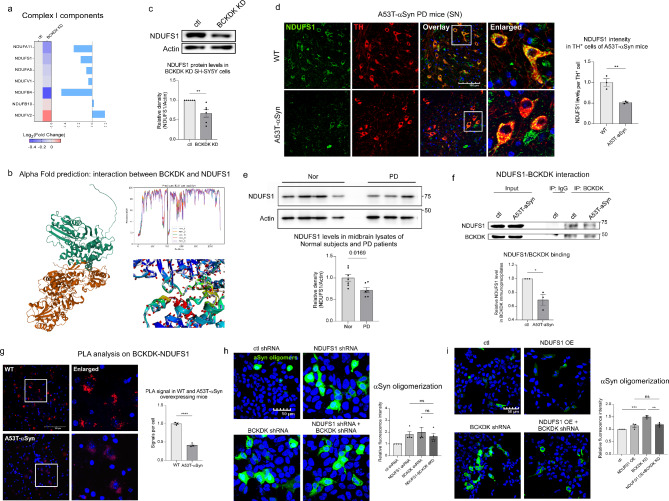
Fig. 4.
BCKDK interacts with NDUFS1, a subunit of Complex I. (a) Proteomic analysis identifies seven Complex I subunits altered in BCKDK knockdown cells. (b) AlphaFold2 structural prediction of a potential binding site between BCKDK (green) and NDUFS1 (orange). Predicted IDDT per position and close-up of the predicted interaction site are shown. (c) Total lysates of control and BCKDK knockdown SH-SY5Y cells were subjected to Western blotting (WB) using the indicated antibodies. WB density of the NDUFS1 signal was quantitated and normalized to that of β-Actin (labeled Actin). n = 6 independent experiments. (d) Immunofluorescence staining was performed in 12-month WT and A53T-αSyn mouse sections using anti-NDUFS1 and anti-TH antibodies. Fluorescence intensity of NDUFS1 was quantified per TH+ cell, and the average was obtained for each repeat. n = 3 mice/group; scale bar: 100 μm. (e) Total lysates from the midbrains of postmortem healthy individuals and PD patients were analyzed via Western blot using anti-NDUFS1 and anti-β-Actin antibodies. NDUFS1 band density was normalized to β-Actin for each sample, then all samples were normalized to the average of the control group. n = 7 healthy, 6 PD. (f) Coimmunoprecipitation was performed on SH-SY5Y cells stably expressing either myc or A53T-αSyn-myc plasmids, with anti-BCKDK antibody. IgG was used as a negative control. After pulldown, samples were assessed via Western blot using anti-NDUFS1 and anti-BCKDK antibodies; NDUFS1 signal density was normalized to BCKDK signal density, and the myc and A53T- αSyn-myc groups were compared. n = 3 independent experiments. (g) Proximity ligation assay was conducted on 12-month WT and A53T-αSyn mouse brain sections using anti-BCKDK and anti-NDUFS1 antibodies. Fluorescent puncta represent the proximity between the two proteins. n = 3 mice/group; scale bar: 100 μm. (h) HEK293 cells were co-transfected with αSyn tagged with N and C fragments of the Venus fluorophore and either control shRNA, NDUFS1 shRNA, BCKDK shRNA, or NDUFS1 shRNA and BCKDK shRNA. Cells were imaged 48 h after transfection. Fluorescence intensity per expressing cell was quantified. n = 4 independent experiments. (i) HEK293 cells were co-transfected with αSyn tagged with N and C fragments of the Venus fluorophore and either control plasmids (ctl shRNA and myc), NDUFS1-myc expression plasmid, or BCKDK shRNA. Cells were imaged 48 h after transfection and fluorescence intensity per expressing cells was quantified. n = 3 independent experiments. All data shown are mean ± SEM from at least 3 independent experiments; all data are analyzed using either Student’s t test or One-way ANOVA

