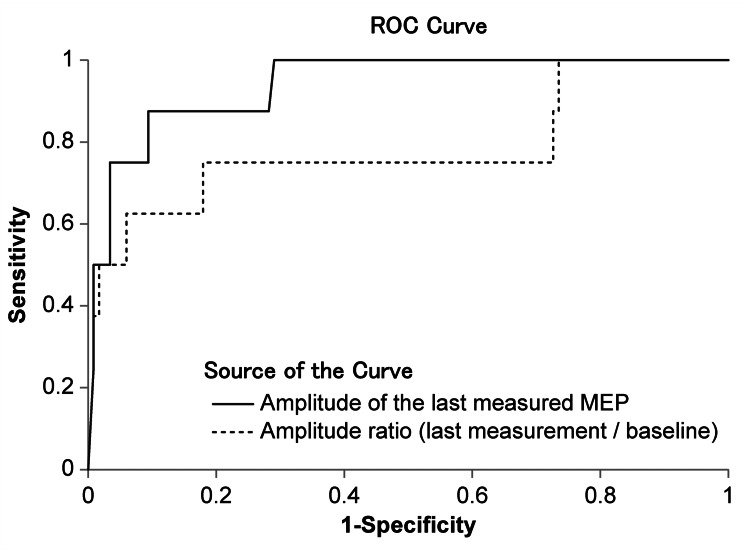
Figure 3. Prediction performance and area under the ROC curves of the amplitude of the last measured MEP and amplitude ratio using internal tests.
ROC curves are drawn using these two variables and the AUCs are compared. The two variables are used to calculate a cutoff value to discriminate postoperative motor function.
ROC: receiver operating characteristic; MEP: motor evoked potential; AUC: area under the curve

