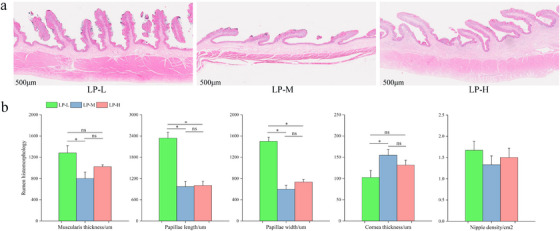
FIGURE 1.

Histological analysis of the rumen tissue. (a) Representative histological sections of the rumen from the three experimental groups (LP‐L, LP‐M and LP‐H). Scale bars represent 500 µm. (b) Quantitative measurements of muscularis thickness, papillae length, papillae width, corneal thickness and nipple density. Data are presented as mean ± SD. Statistical significance is indicated as follows: *p < 0.05.
