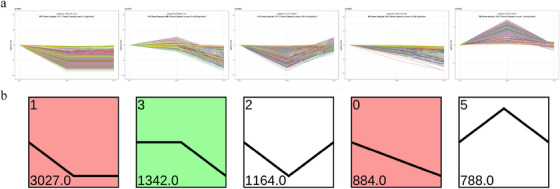
FIGURE 4.

Trend analysis of gene expression. (a) Gene expression profiles over various conditions or time points. Each line represents a distinct gene, with the y‐axis denoting gene expression levels. (b) Clustering of gene expression profiles. Clusters are grouped on the basis of their expression trends, with the representative trend for each cluster and corresponding gene count shown.
