
FIGURE 6.
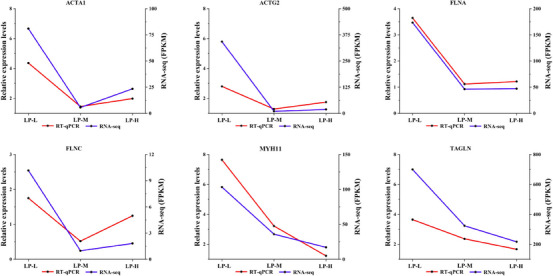
Validation of RNA sequencing (RNA‐seq) data by RT‐qPCR. Relative expression levels of ACTA1, ACTG2, FLNA, FLNC, MYH11 and TAGLN measured by RT‐qPCR and RNA‐seq. Data are presented as mean ± SD from three biological replicates.
Official websites use .gov
A
.gov website belongs to an official
government organization in the United States.
Secure .gov websites use HTTPS
A lock (
) or https:// means you've safely
connected to the .gov website. Share sensitive
information only on official, secure websites.
Validation of RNA sequencing (RNA‐seq) data by RT‐qPCR. Relative expression levels of ACTA1, ACTG2, FLNA, FLNC, MYH11 and TAGLN measured by RT‐qPCR and RNA‐seq. Data are presented as mean ± SD from three biological replicates.