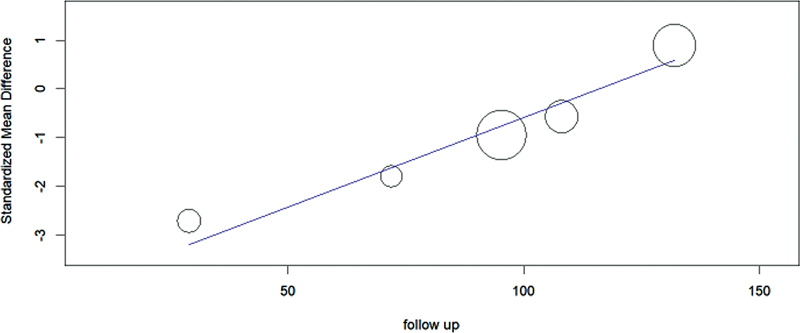
Fig. 3.

Scatter plot showing the standardized mean difference (SMD) estimates for the functional restoration after resection versus curettage on y-axis and follow-up duration on x-axis, in which the circles show the effect size of studies, with the slope of the line explaining the overall trend.
