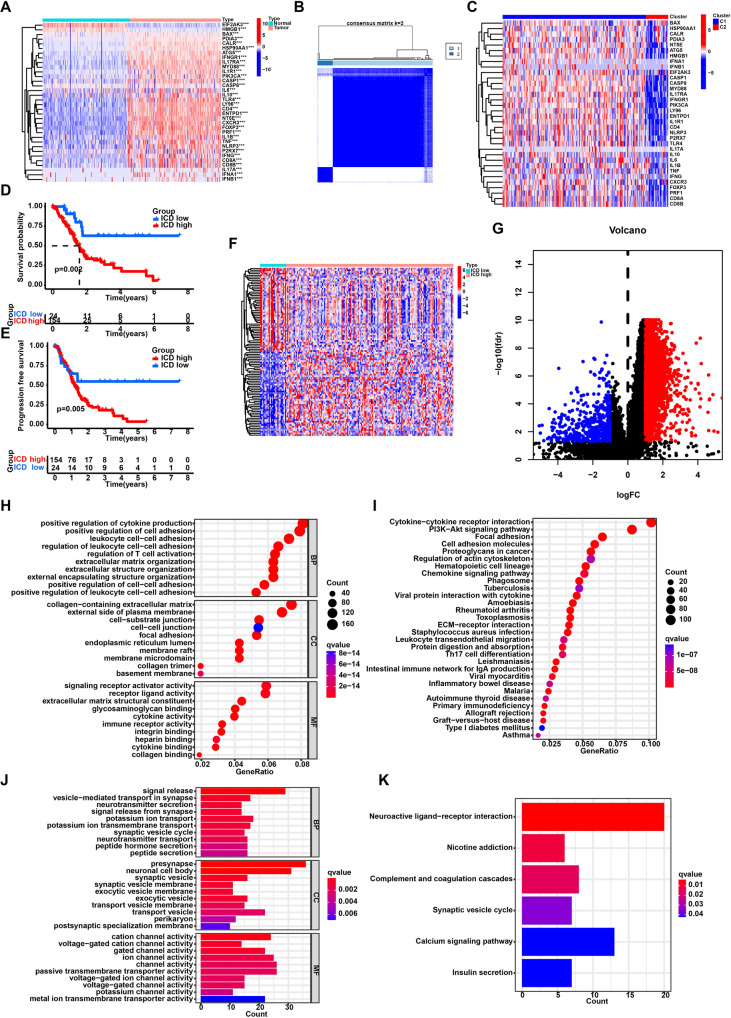
Fig. 1.
Identification of the ICD-related clusters in pancreatic cancer. A The expression patterns of ICD genes in pancreatic cancer samples and normal pancreas tissues. B The heatmap of consensus clustering solution (k = 2) in pancreatic cancer samples. C The expression of ICD genes in two clusters. D Kaplan–Meier curve of overall survival in two clusters. E Kaplan–Meier curve of progression free survival in two clusters. F The heatmap of differently expressed genes between two clusters. G The volcano plot of differently expressed genes between two clusters. H GO analysis of highly expressed genes in the ICD-high clusters. I KEGG enrichment analysis of highly expressed genes in the ICD-high clusters. J GO analysis of highly expressed genes in the ICD-low clusters. K KEGG enrichment analysis of highly expressed genes in the ICD-low clusters. ***P < 0.001; **P < 0.01; *P < 0.05

