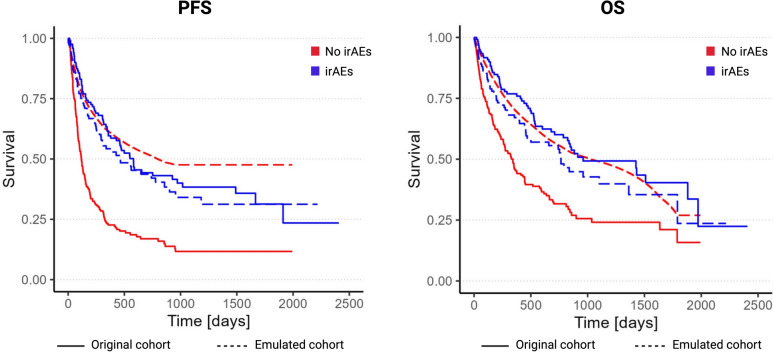
Fig. 2.
Contrasting Kaplan–Meier curves (irAEs vs. no irAEs) derived from the original cohort (naive analysis; solid lines) versus Kaplan–Meier curves from the emulated cohort (TTE approach; dashed lines). Red—no irAE group. Blue—irAE group. Numbers at risk taken from the naïve analysis. (P values by log-rank test. PFS: p < 0.001 for original cohort; p = 0.04 for emulated cohort; OS: p < 0.001 for original cohort; p = 0.2 for emulated cohort)

