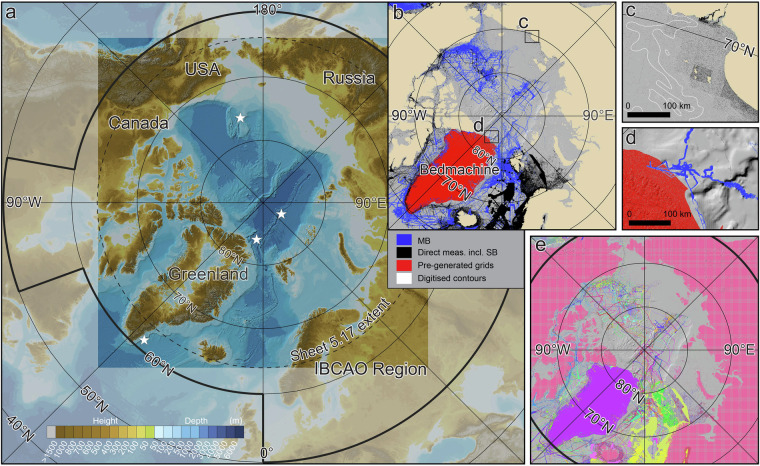
Fig. 1.
Overview maps illustrating Arctic Ocean bathymetry and source data for the compilation of IBCAO 5.0. (a) Bathymetry based on IBCAO 5.0. Two versions are available: one with under-ice topography of Greenland (shown), and another with the ice-sheet surface topography, both based on BedMachine Version 5 DMT180. The bold black line shows the Seabed 2030 Arctic region, for which a geographic DTM is produced and contributed to the global GEBCO DTM. The square region shown in brighter colours represents the more limited extent of the IBCAO DTM. White stars show the locations of detailed comparison between IBCAO 5.0 and 4.0 in Fig. 9. (b) Source data displayed based on the mapping method (MB = Multibeam; SB = Singlebeam). (c) Close-up of the East Siberian Sea depicting soundings from charts (in black) and digitised contours (in white). The nodes of the digitised contours, utilised in the gridding process, may be challenging to discern due to their sparse density. To enhance visibility, several contours are presented as polygons in white. (d) Close-up of North Greenland showing a part of the least mapped area of the Arctic Ocean. (e) Source data displayed as individual data sets using different colours. Note that the high resolution of the IBCAO 5.0 gridded products precludes displaying fine details in overview figures. For detailed information, readers are referred to the downloadable grids.

