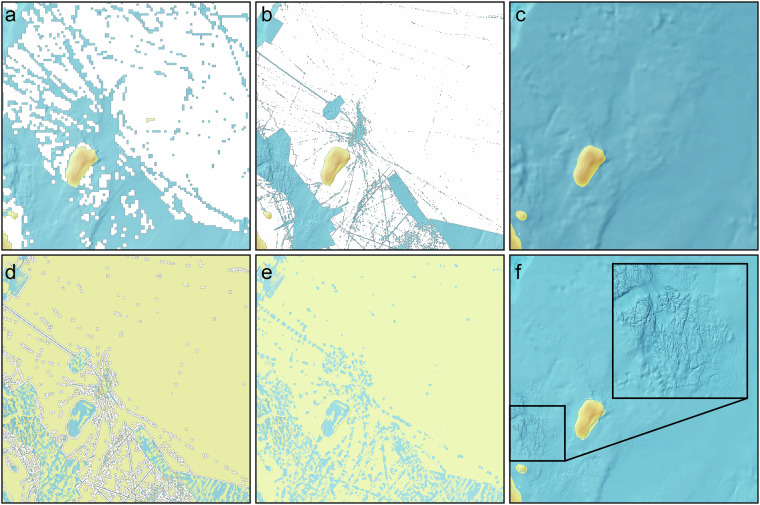
Fig. 5.
Visualisations of the outcome of some of the main gridding steps. The island is Kvitøya in eastern Svalbard. (a) Block median at 2,000 × 2,000 m of all data including both low- and high-resolution data after calculation step 5. (b) Blockmedian at 100 × 100 m after upsampling, showing the result of calculation step 5. (c) Low resolution 2,000 × 2,000 m interpolated, smoothed and resampled base grid produced using the blockmedian grid and the Generic Mapping Tools (GMT) spline in tension function27 in step 8. (d) Difference between (b,c), after applying a 20 grid cell empty buffer zone around high-resolution data in calculation step 10. (e) Interpolated difference values filling the buffer zones to make a smooth transition between high- and low-resolution data, also in step 10. (f) Restored final grid where the grid in e is added to b.

