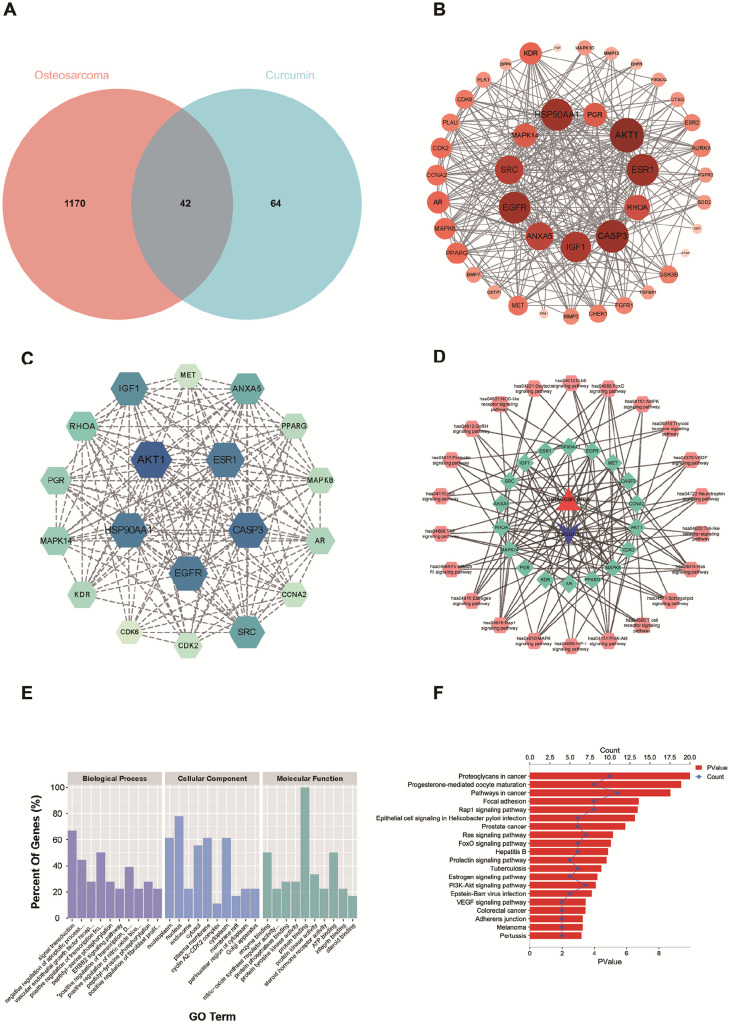
Figure 2.
(A) Venn diagram depicting the number of commen targets of between Cur and OS; (B) Protein-protein interaction network analysis; (C) GO functional enrichment and KEGG pathway enrichment of commen targets; (D) Construction of C-T-O-P network; (E, F) GO functional enrichment and KEGG pathway enrichment of common gene targets.

