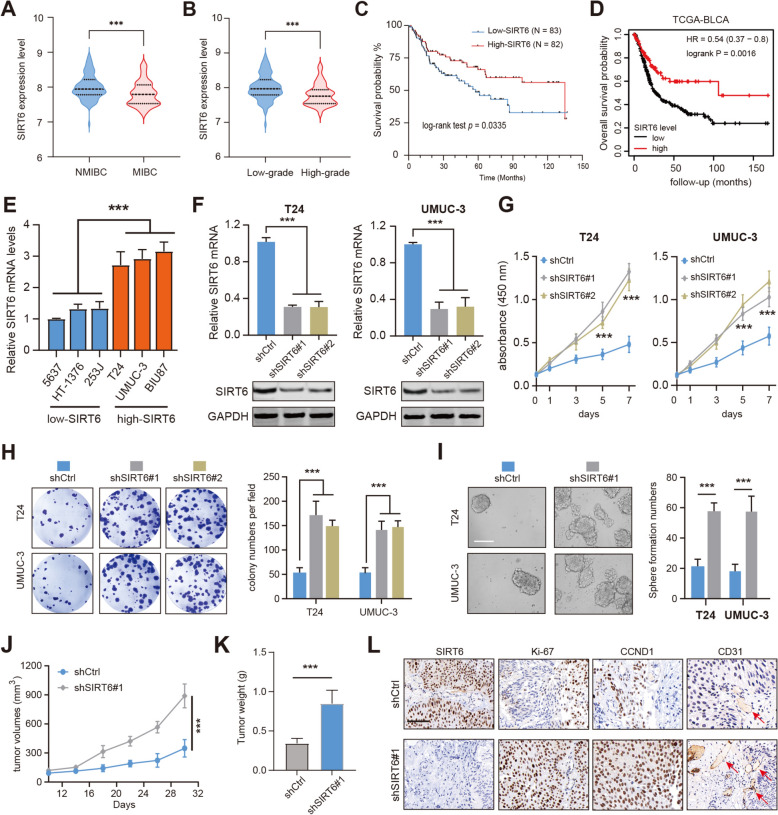
Fig. 1.
The prognostic analysis of SIRT6 in BLCA and its functional validations. A Differential analysis of SIRT6 expression levels between NMIBC and MIBC samples. B Differential analysis of SIRT6 expression levels between high-grade and low-grade BLCA samples. C Kaplan–Meier analysis shows the differential prognosis between SIRT6-high and SIRT6-low BLCA patients in GSE13507. D Kaplan–Meier analysis shows the differential prognosis between SIRT6-high and SIRT6-low BLCA patients in TCGA-BLCA. E RT-qPCR analysis was conducted to determine SIRT6-high and SIRT6-low BLCA cell lines. F Western blotting assays showing the SIRT6 proteins in T24 and UMUC-3 cells with or without SIRT6 depletion. G Knockdown of SIRT6 increased cell viability as indicated by CCK-8 proliferation assay. H SIRT6 knockdown in T24 or UMUC-3 cells increased the colony formation capacity of these cells. I Sphere formation assays showing the self-renewal capacities of control or shSIRT6 BLCA cells. J-K Quantification of subcutaneous tumor growth curve (J) and weights (K) of tumors derived from control and SIRT6-KD UMUC-3 cells (2-way ANOVA followed by Tukey’s multiple comparisons tests); scale bar = 1 cm. L Representative IHC graphs showing the intensity of SIRT6, Ki-67, CCND1, and CD31 in tumors derived from control and SIRT6-KD UMUC-3 cells. *p < 0.05, **p < 0.01, ***p < 0.001, ns no significance

